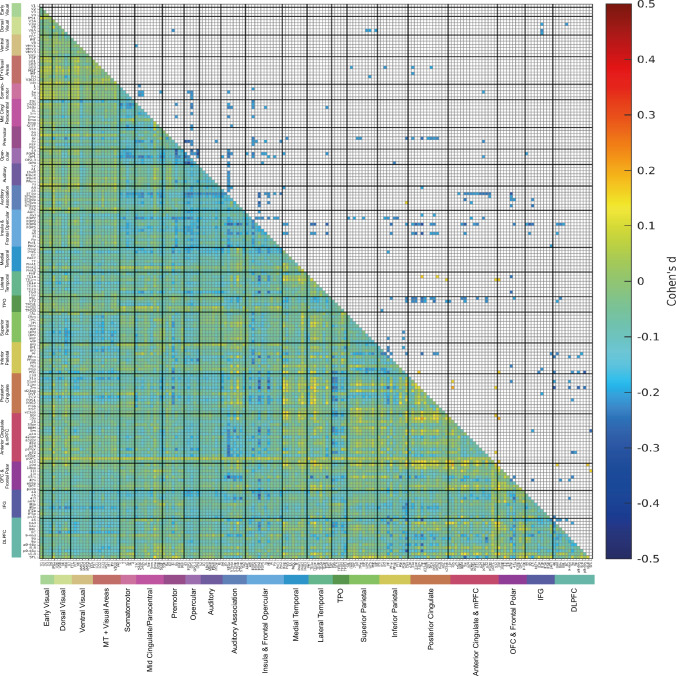
Fig. 5.
The lower left triangle shows the matrix of functional connectivity differences for females—males with the Cohen’s d values showing the effect size of the differences. The standard covariates were regressed out, but also so too were Field 6032 Maximum workload during fitness test and Field 23,100 Whole body fat mass as covariates in the two-sample t-tests. The matrix is for the functional connectivities in the left hemisphere, as listed in Table S1, with V1, V2, V3 … at the top of the y axis and the left of the x axis. The upper triangle matrix shows the Cohen’s d values of top 20% significant negative links and all significant positive links after Bonferroni correction (corrected p < 3.1e−6). These results were from 2099 females and 1889 males. All the values shown in the matrix were in the range from − 0.5 to 0.5

