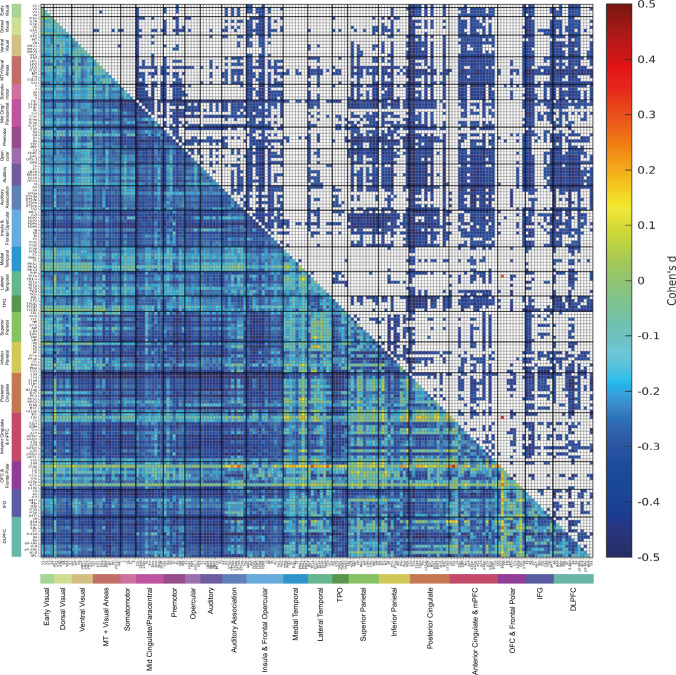
Fig. 6.
Differences in resting state functional connectivity in females—males with data from 1000 individuals (532 females) in the Human Connectome Project. The lower left triangle shows the Cohen’s d values for the differences, and the upper right triangle shows the differences that were significant after Bonferroni correction for the number of comparisons made in the functional connectivity matrices for the left hemisphere. Negative values in this matrix indicate lower functional connectivities in females. All the values shown in the matrix were in the range from − 0.5 to 0.5. The conventions are as in Fig. 3

