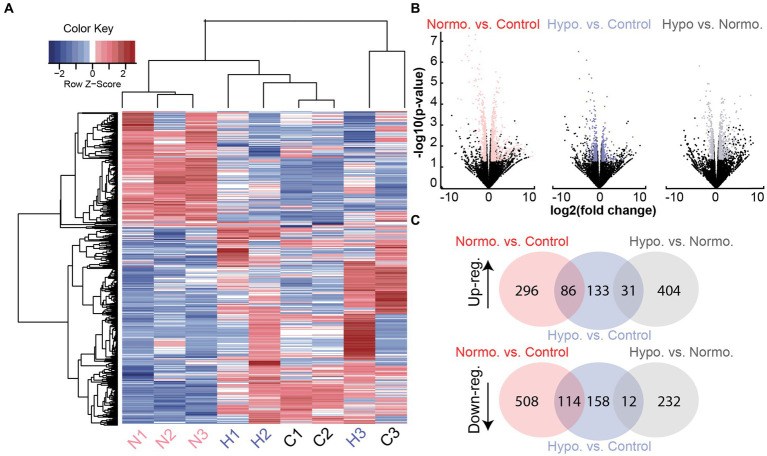
Figure 2.
Differentially expressed gene transcripts from Noise + Hypothermia, Noise + Normothermia, and unexposed control groups. (A) Heatmap dendrogram of DEGs at 24 h in the three groups: normothermia (N1, N2, N3, pink), hypothermia (H1, H2, H3), and controls (C1, C2, C3). Hierarchical clustering of gene rows indicated expression patterns between the samples with indicated Z-scores of above-average (red) or below-average (blue) expression levels. (B) Gene counts from all group comparisons visualized by volcano plot indicating biological significance as a measure of nominal value of p and fold change. Out of 32,494 total genes compared between the groups, filtered protein-coding DEGs are highlighted per group comparison indicating a value of p < 0.05 and abs(log2 fold change) ≥ 1.5. Multiple testing corrections used the Benjamini and Hochberg method with the false discovery rate (FDR) calculated for each gene. Illustrated group comparisons are shown for normothermia versus control (NvC, red), hypothermia versus control (HvC, blue), and hypothermia versus normothermia (HvN, black). (C) Venn diagrams showing all shared and unique DEGs in the three group comparisons separated by upregulation (Up-reg.) and downregulation (Down-reg.).

