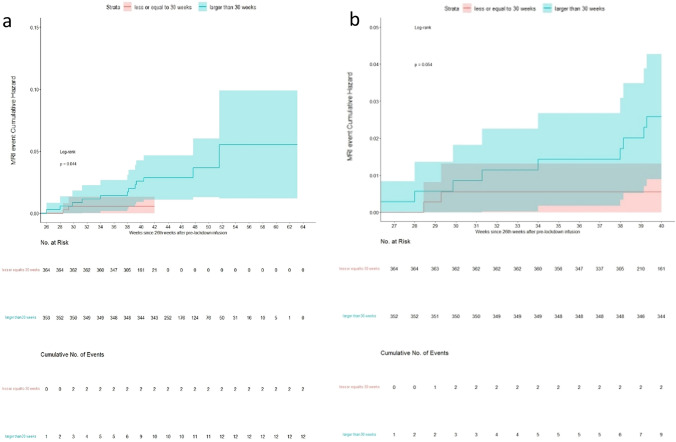
Fig. 4.
a MRI events Cumulative Hazard curves of two populations, compared according to the dichotomized DELTA LOCK-PRE-LOCK: patients were divided by setting a DELTA LOCK-PRE-LOCK (time interval, in weeks, between the pre-lock and the lock cycle) cut-off at 30 weeks, b MRI events Cumulative Hazard curves, right-censored at 40 weeks after pre-lock infusion: the two populations were compared according to dichotomized interval dosing ≤ 30 weeks versus > 30 weeks, focusing the analysis within the 40th week after pre-lock infusion

