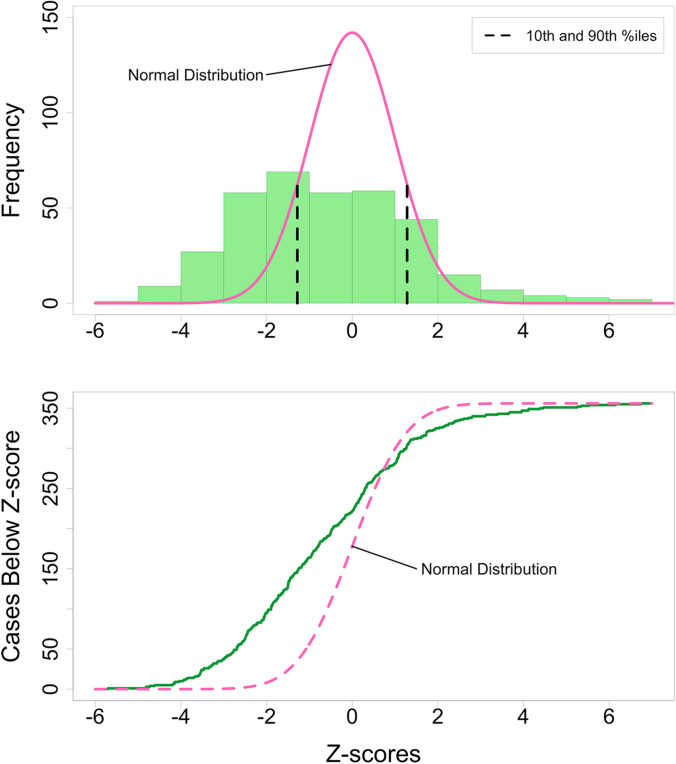
Fig. 7.
Normal versus loss case series weight distributions. (Upper) Normal placenta z-score weight distribution (pink line) compared to this loss case series (green columns). Tenth and 90th percentiles (black dashed lines) are indicated for reference. (Lower) q-q plot to illustrate excess number of small (47 cases) and large (20 cases) placentas (green line) compared to the normal placenta z-score weight distribution (pink dashed line). Two large outliers with z-scores of + 9 and + 16.6 were not plotted

