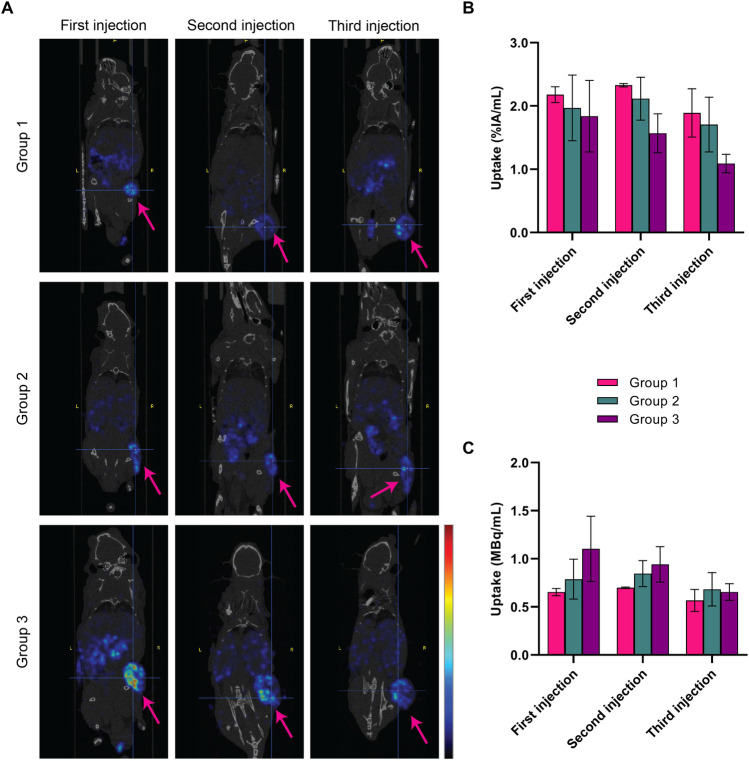
Fig. 2.
Representative SPECT/CT images (A) acquired 4 h post the first, second, and third injection of animals treated with 3 × 30 MBq/300 pmol (group 1), 3 × 40 MBq/400 pmol (group 2), or 3 × 60 MBq/600 pmol of [177Lu]Lu-NeoB (group 3). Images show an overlay of a CT slice and the corresponding SPECT slice on which the cross-section of the tumor is clearly visible. Arrows indicate the tumor and the scale bar shows the linear scaling running from min-max of the signal present in the images. The mean quantified tumor uptake with the range is expressed as %IA/mL (B) and MBq/mL (C) (n = 2 per group)

