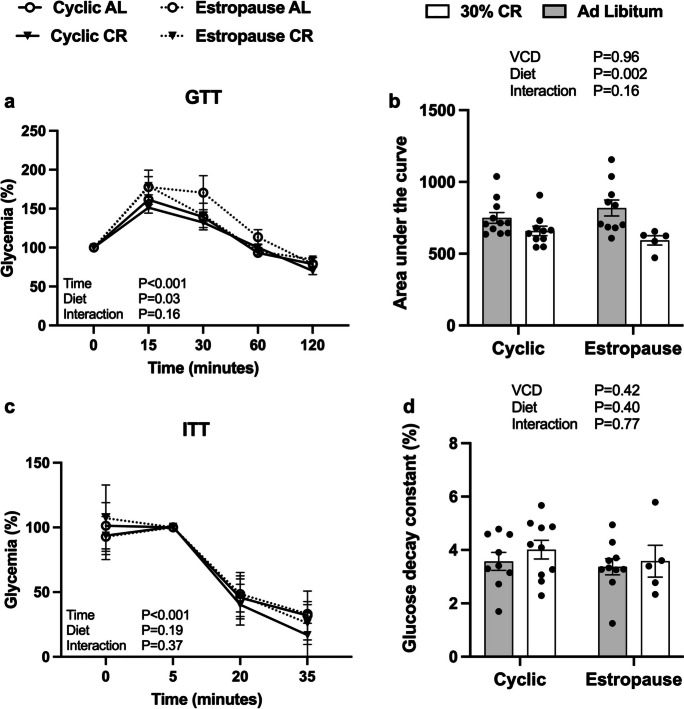
Fig. 2.
a Glucose levels during the glucose tolerance test (GTT); b area under the curve (AUC) for the GTT; c glucose levels during the insulin tolerance test (ITT); d glucose decay constant (KITT) during the first 15 min of the ITT for the AL cyclic, 30% CR cyclic, AL estropause and 30% CR estropause

