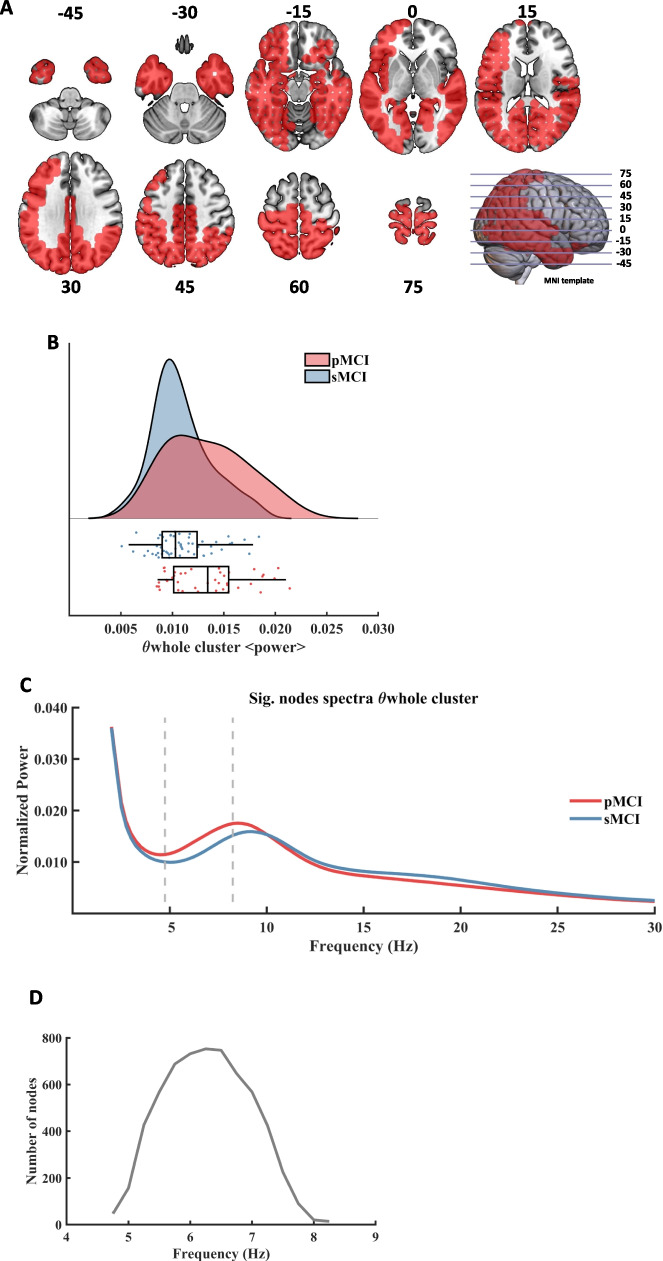
Fig. 1.
Significant result found within the theta frequency range in the comparison between pMCI and sMCI groups. A: description of the regions involved in the θwhole cluster at its maximum extension (found at 6.25 Hz). The cluster was found to be significant between 4.75 Hz and 8.25 Hz. Each slice shows the brain below the reference plane defined by the corresponding line on the template. The numbers report the depth in MNI coordinates (mm). B: Violin plots and box plots representing the individual values of the cluster's representative markers. Markers were calculated as the average power across all significant nodes and frequency steps. The sMCI group is marked in blue color and the pMCI group is marked in red color. C: representation of the average spectral power across all significant nodes. The significant frequency region is marked with dashed lines. The sMCI group is marked in blue color and the pMCI group is marked in red color. D: number of grid nodes that are part of the cluster at each frequency step (14 nodes as minimum and 753 as maximum)

