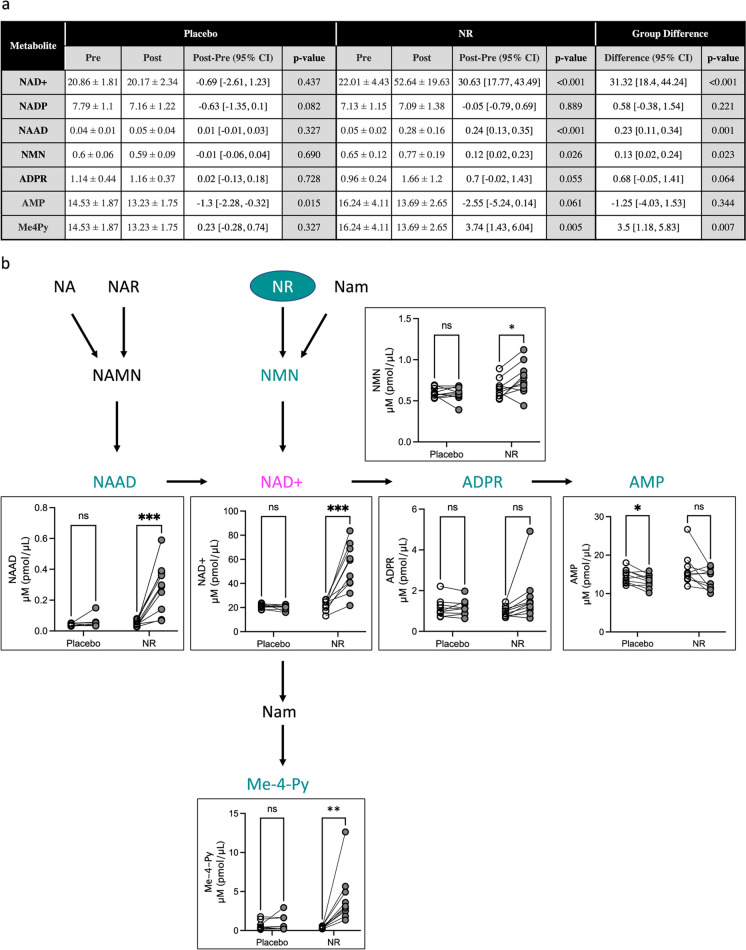
Fig. 3.
Oral supplementation with NR alters NAD+ blood metabolism. a Whole blood levels of NAD+ and associated metabolites from placebo- and NR-treated subjects before and after treatment. The pre-/post-difference relative baselines were estimated using the paired t-test and 95% confidence intervals, and the between-group differences were evaluated with the Welch t-test. b Diagram of NAD+ metabolism depicting analytes that significantly changed during the study. Data are plotted as within subject pre- vs post-levels. Open circles, baseline levels; gray circles, post-treatment values. Lines connect individual subjects. n = 10/group. *p < 0.05; **p < 0.01; ***p < 0.001. NR, nicotinamide riboside; NaM, nicotinamide; NA, nicotinic acid; NAR, nicotinic acid riboside; NAMN, nicotinic acid mononucleotide; NMN, nicotinamide mononucleotide; NAAD, nicotinic acid adenine dinucleotide; NAD+, nicotinamide adenine dinucleotide; ADPR, ADP-ribose; AMP, adenosine monophosphate; Me-4-Py, N-methyl-4-pyridone-5-carboxamide

