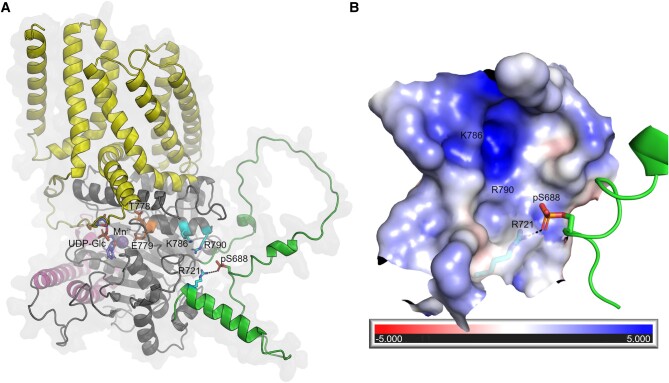
Figure 6.
Structural basis for the effects of CESA phosphorylation. A)AtCESA1 model showing the transmembrane domain (yellow), PCR (magenta), and CSR (green). Residues R721, K786, and R790 that contribute to the positive electrostatic potential in the pocket, the modeled phosphoserine (pS688), and TED motif (T778 and E779) are shown in cyan, green, and orange, respectively. Black dashes indicate the possible interaction between pS688 and R721. The UDP-Glc (purple) and Mn2+ (sphere) ligands from the crystal structure of the AtCESA3 catalytic domain (PDB 7CK2) are superimposed onto the AtCESA1 model for comparison. B) The largely positive electrostatic potential of the pocket near the pS688 site is mapped onto the surface. The positions of residues R721, K786, and R790 are indicated. The potentials are on a (−5, 5) red–white–blue color map in units of kBTec-1.

