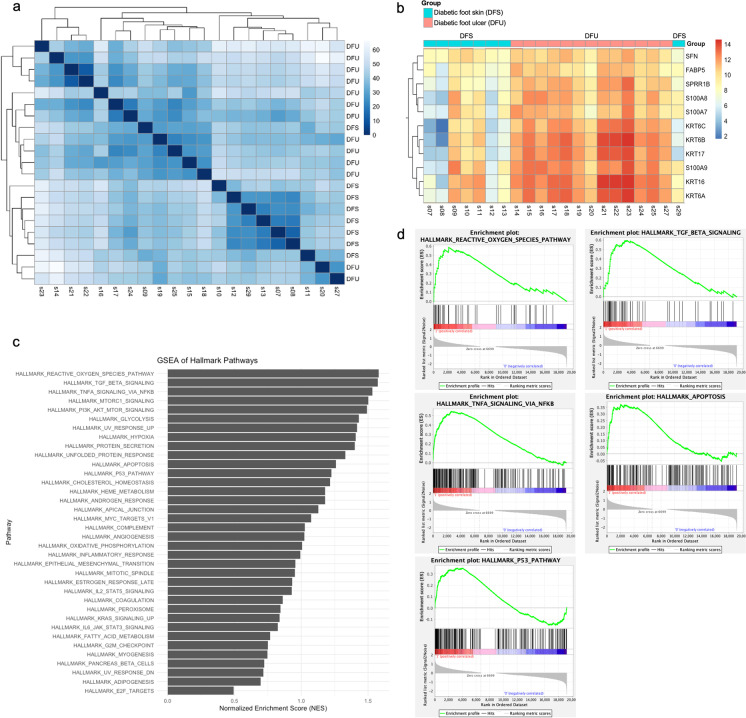
Fig. 1.
Hierarchical clustering of RNA sequencing of samples from the diabetic foot ulcer (DFU, n = 13) and uninvolved diabetic foot skin (DFS, n = 8) groups. a Heat map of sample-to-sample distances. b Heat map of count matrix. c Gene set enrichment analysis of hallmark gene set, with pathways enriched in DFU compared to DFS. d Gene set enrichment analysis of top 3 upregulated pathways in DFU (reactive oxygen species, TGF-β signaling, and TNF-α signaling via NF-κB), as well as apoptosis and p53 pathways

