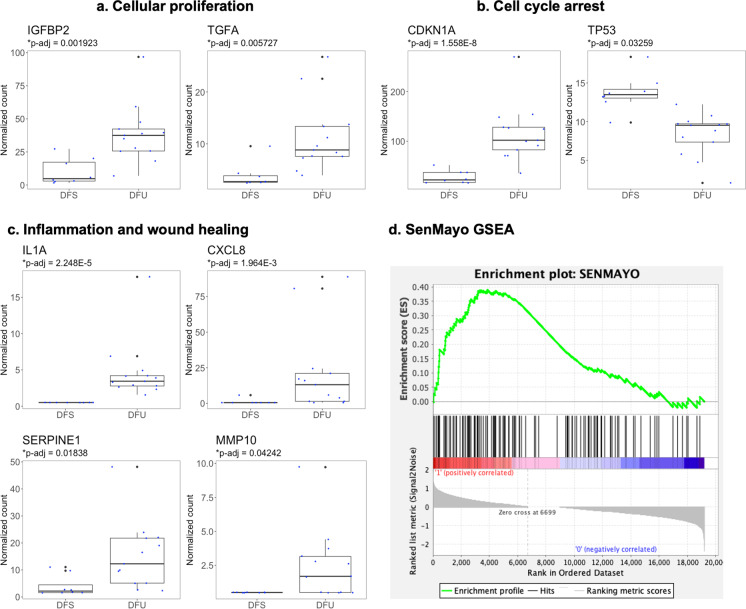
Fig. 2.
Differences in cellular senescence profiles, comparing samples from the diabetic foot ulcer (DFU, n = 13) and uninvolved diabetic foot skin (DFS, n = 8) groups. Boxplots include 25th (Q1) and 75th (Q2) percentiles, interquartile range (IQR), median, and potential outliers (Q1 − 1.5IQR or Q3 + 1.5IQR). Wald tests with Benjamini–Hochberg correction were performed to compare DFS and DFU for each gene. Only markers with significantly different expression levels between the two groups (p-adj < 0.05) are presented

