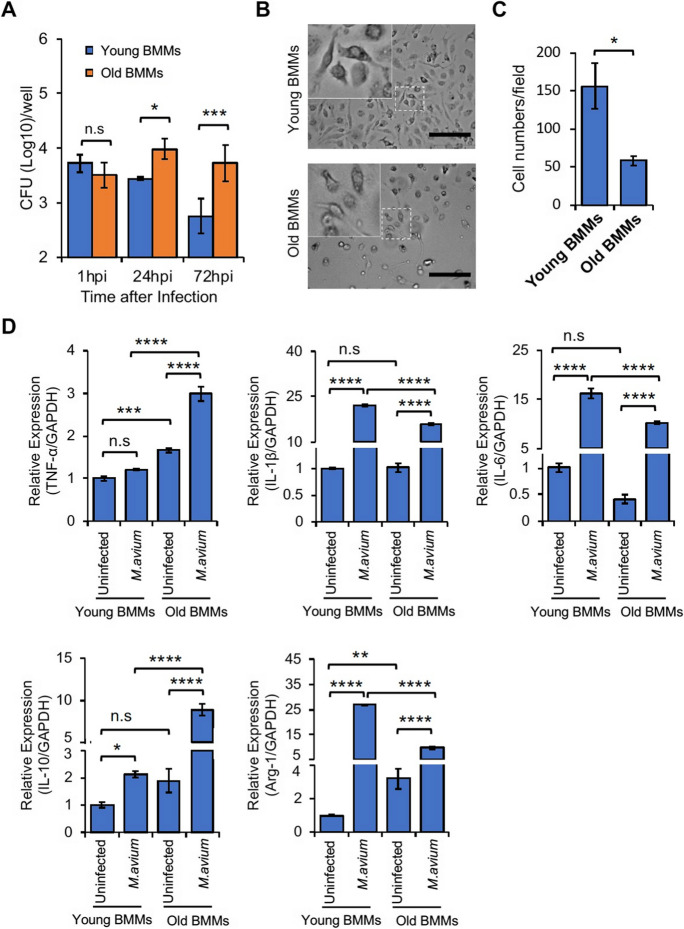
Fig. 1.
Mouse BMMs response to M. avium infection in vitro. A) M. avium survival assay. BMMs from young and old mice were infected with M. avium in cell culture at a MOI = 5 and then mycobacterial number within BMMs was determined at 1, 24, and 72 h post-infection. B) Microscopy images for mouse BMMs in cell culture. C) Quantitative analysis for microscopy images in (B). D) Similar to (A), but qRT-PCR analysis for TNF-α, IL-1β, IL-6, IL-10, and Arg-1 in BMMs uninfected or infected with M. avium for 24 h. Each transcript level was normalized to Gapdh and was expressed as fold change relative to uninfected young BMMs. In (A) and (D), data are presented as the mean ± SD (n = 3). All the results are representative of 3 independent experiments. n.s., not statistically significant; *p < 0.05, **p < 0.01, ***p < 0.001, and ****p < 0.0001 by one-way ANOVA, followed by Tukey’s post hoc test

