
Fig. 5.
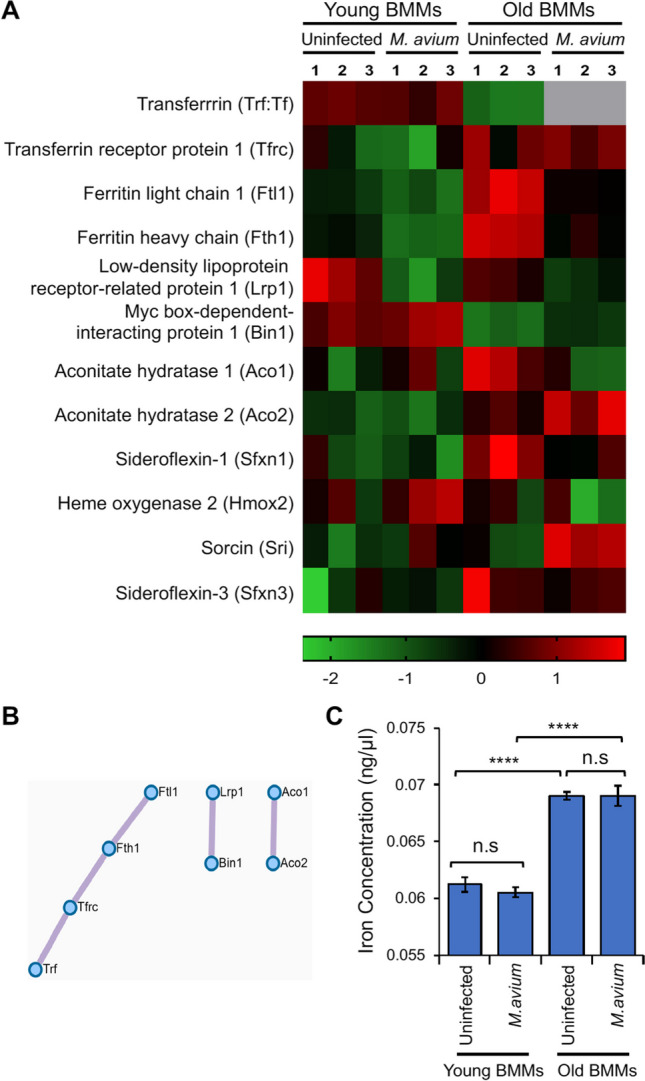
Iron homeostasis in BMMs from young and old mice with/without M. avium infection. A) Heatmap for iron homeostasis–associated proteins identified in the proteomic analysis. B) Metascape protein–protein Interaction network for iron homeostasis–associated proteins shown in (A). C) Intracellular iron concentration in young and old BMMs that were uninfected or infected with M. avium (MOI = 5) for 24 h. In (C), data are presented as the mean ± SD (n = 3) and representative of 3 independent experiments. n.s., not statistically significant; ****p < 0.0001 by one-way ANOVA, followed by Tukey’s post hoc test