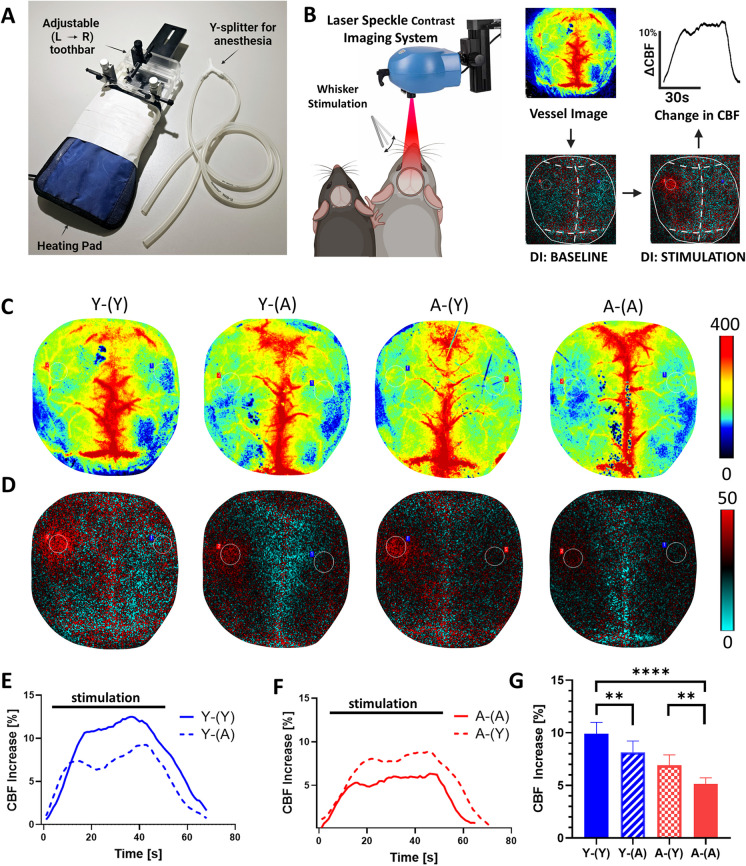
Fig. 2.
Young blood rejuvenates NVC responses in aged heterochronic parabionts, whereas old blood impairs NVC responses in young heterochronic parabionts. A The parabiont-adjusted stage is illustrated, allowing for consecutive measurements of NVC responses in both parabionts. This specialized stage provides stabilization for the head of the measured animal while enabling unrestricted movement of the co-parabiont’s head. Furthermore, it facilitates separate anesthesia for both parabionts, with the measured parabiont receiving ventilation and the co-parabiont undergoing anesthesia via a face mask. B A schematic representation portrays both parabionts positioned beneath the laser speckle contrast imaging (LSCI) system for data acquisition. The difference image reveals alterations in cerebral blood flow during baseline and stimulation (highlighted in red within the somatosensory cortex). The percentage change in cerebral blood flow within this cortex region is quantified, representing the neurovascular coupling response. This quantification is depicted graphically as the change in cerebral blood flow over time. C Representative pseudocolor laser speckle flowmetry maps of baseline CBF in Y-(Y), Y-(A), A-(Y) and A-(A) parabionts, shown for orientation purposes. D Representative pseudocolor laser speckle flowmetry differential images showing CBF changes in the whisker barrel field relative to baseline during contralateral whisker stimulation (left oval, 30 s, 5 Hz) in Y-(Y), Y-(A), A-(Y) and A-(A) parabionts. Color bar represents CBF as a percent change from baseline. E, F The time course of CBF changes after the start of contralateral whisker stimulation (horizontal bars) in Y-(Y) and Y-(A) (E) and A-(Y) and A-(A) parabionts (F). Summary data are shown in G. Note that young blood rejuvenates NVC responses in aged heterochronic parabionts, whereas old blood impairs NVC responses in young heterochronic parabionts, mimicking the aging phenotype. Data are mean ± S.D. (one-way ANOVA with post-hoc Tukey’s tests, n = 8 in each group, **p < 0.01, ****p < 0.0001)

