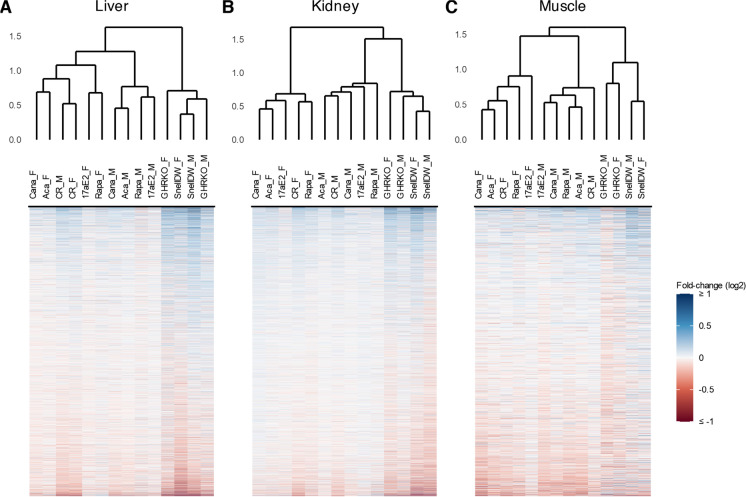
Fig. 1.
Dendrograms of co-sine distances in protein log2 fold-changes among intervention-sex groups (top; the suffixes “_F” and “_M” indicate female and male groups respectively) and heatmaps of protein fold-changes compared to respective controls by intervention-sex group (bottom) for liver (A), kidney (B), and muscle samples (C). The color scale for protein fold-changes is capped at +/- log2(1) to enhance legibility of modest fold-changes. Proteins are arranged on the y-axis separately for each tissue based on mean fold-changes across groups

