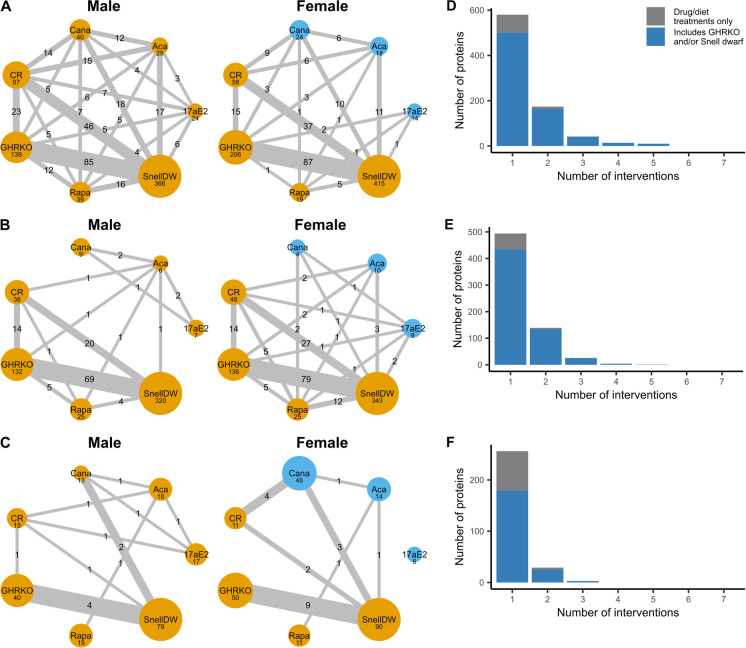
Fig. 3.
A–C Networks of shared protein responses across interventions in male and female mouse liver (A), kidney (B), and muscle (C) samples. Node size corresponds to the number of proteins with log-fold changes ≥ 0.5 associated with a Bayes factor ≥ 10 in each longevity intervention, while edge width represents the number of those proteins shared between two interventions. Nodes in yellow represent interventions expected to promote longevity while those in blue represent interventions in which the longevity-promoting effect is negligible or absent. D–F The number of proteins that are significantly affected by multiple interventions, regardless of sex in mouse liver (D), kidney (E), and muscle (F) samples. The x-axis gives the largest number of interventions a protein is affected by. The blue area represents the number of proteins that are significantly affected by GHRKO and/or Snell dwarf, while the gray area quantifies proteins only affected only by drug/diet treatments

