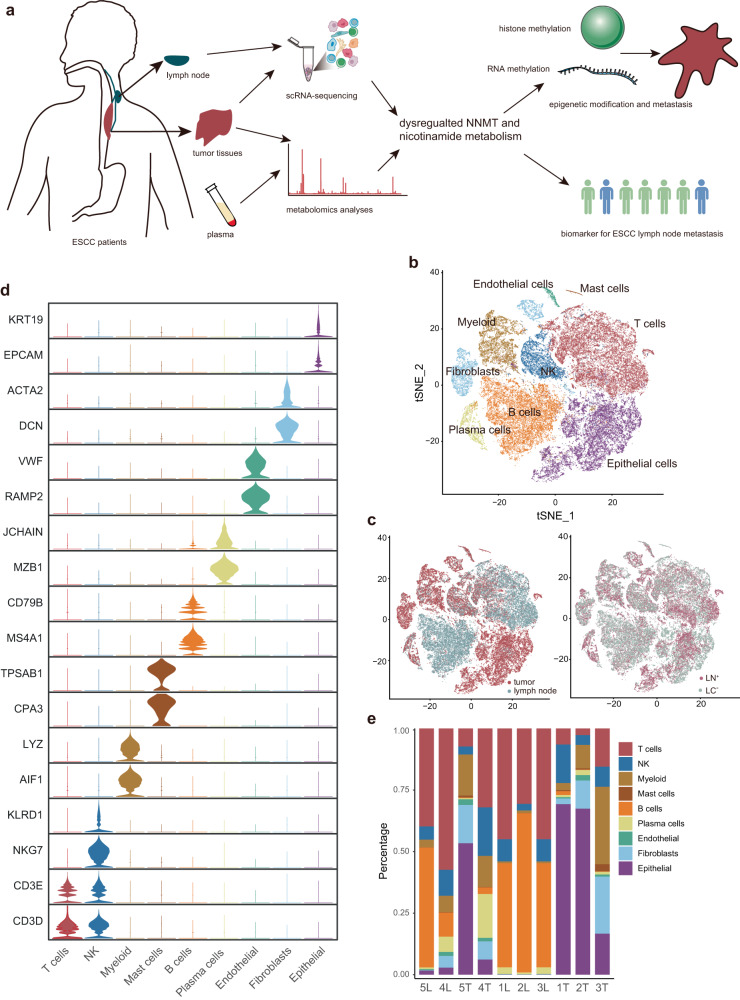
Fig. 1. Cellular atlas of ESCC tumor tissues and paired lymph nodes.
a Schematic illustration of scRNA-seq analyses and metabolomics. b Cell populations identified in ESCC tumor tissues and paired lymph node samples. The t Stochastic neighbour Embedding (tSNE) plots for 66,864 high-quality cells from tumor tissues (n = 5) and lymph node samples (n = 5), and nine major cell clusters identified are labeled. Each dot corresponds to a single cell and is colored based on its cell type. c TSNE plots colored by sample origin (left), and lymph node metastatic groups (right). d Violin plots showing expression distribution of marker genes in nine cell types. e The proportion of each cell type in 10 samples. Among all samples, 5 L and 4 L represent mLN; 1 L, 2 L, and 3 L represent nLN; 5 T and 4 T represent LN+ ESCC; 1 T, 2 T and 3 T represent LN− ESCC.

