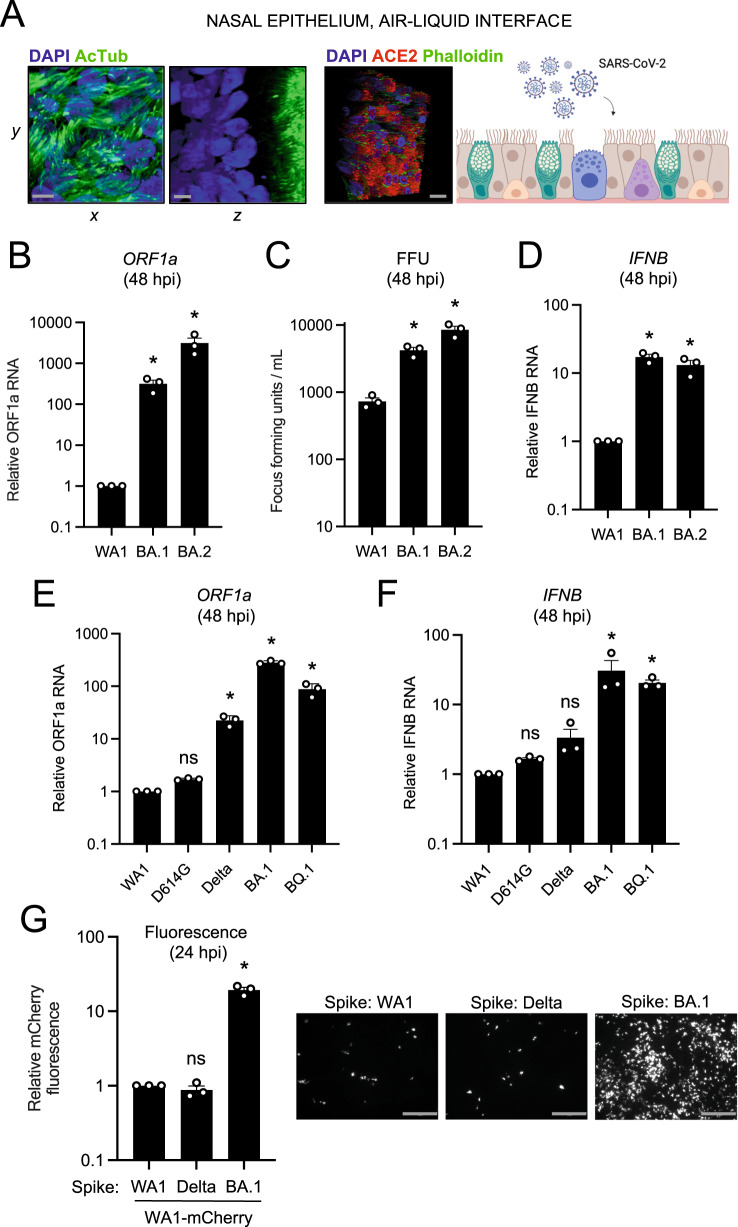
Fig. 2. Omicron Spike enables enhanced SARS-CoV-2 infectivity in primary nasal epithelia cultured at the air–liquid interface.
A Primary human nasal epithelial cells (pooled from 14 donors) were cultured at the air–liquid interface and challenged with SARS-CoV-2. Cells were fixed and permeabilized for confocal immunofluorescence microscopy and stained with anti-AcTub, anti-ACE2, phalloidin, and DAPI. Stacked 3D confocal images in the xy, yz, or xyz fields are shown. Scale bars = 10 µm. Cartoon made with Biorender.com. B RNA was extracted from cells at 48 h post inoculation with 10,000 plaque-forming units of WA1, BA.1, or BA.2, and RT-qPCR of viral ORF1a was performed. Relative ORF1a transcript abundance compared to actin was determined by the 2(−ΔΔCT) method. ORF1a abundance of WA1 was set to 1. C Infectious virus from culture medium collected at 48 h post-inoculation was measured by challenging Vero E6-ACE2-TMPRSS2 followed by fixation/permeabilization, anti-N immunostaining, and high-content imaging. Symbols represent results from three independent infections of Vero E6-ACE2-TMPRSS2 cells. D RT-qPCR of cellular IFNB was performed at 48 h post-inoculation. IFNB abundance of WA1 was set to 1. E Viral ORF1a RT-qPCR was performed at 48 h post-inoculation with 10,000 plaque-forming units of WA1, D614G, Delta, BA.1, or BQ.1. ORF1a abundance of WA1 was set to 1. F RT-qPCR of cellular IFNB was performed at 48 h post-inoculation. IFNB abundance of WA1 was set to 1. G Recombinant WA1 (WA1 Spike), WA1 (Delta Spike), or WA1 (BA.1 Spike) were used to inoculate primary human nasal epithelial cells cultured at the air–liquid interface, and infection was measured by mCherry fluorescence at 24 h post-inoculation. The fluorescence intensity of WA1 (WA1 Spike) was set to 1. Representative fields of view are shown. Scale bars = 300 µm. All results are represented as means plus standard error from three independent infections (biological replicates). Statistically significant differences (*P < 0.05) between the indicated condition and the corresponding condition of WA.1 were determined by one-way ANOVA adjusted for multiple comparisons (exact p values from left to right: B 0.0206, 0.0323; C 0.0265, 0.0005; D 0.0009, 0.0041; E 0.999, 0.0017, 0.0001, 0.0003; F 0.999, 0.998, 0.0215, 0.007; G 0.996, 0.0001). Refer to Supporting Dataset 1 for non-normalized data. Source data are provided as a Source Data file.

