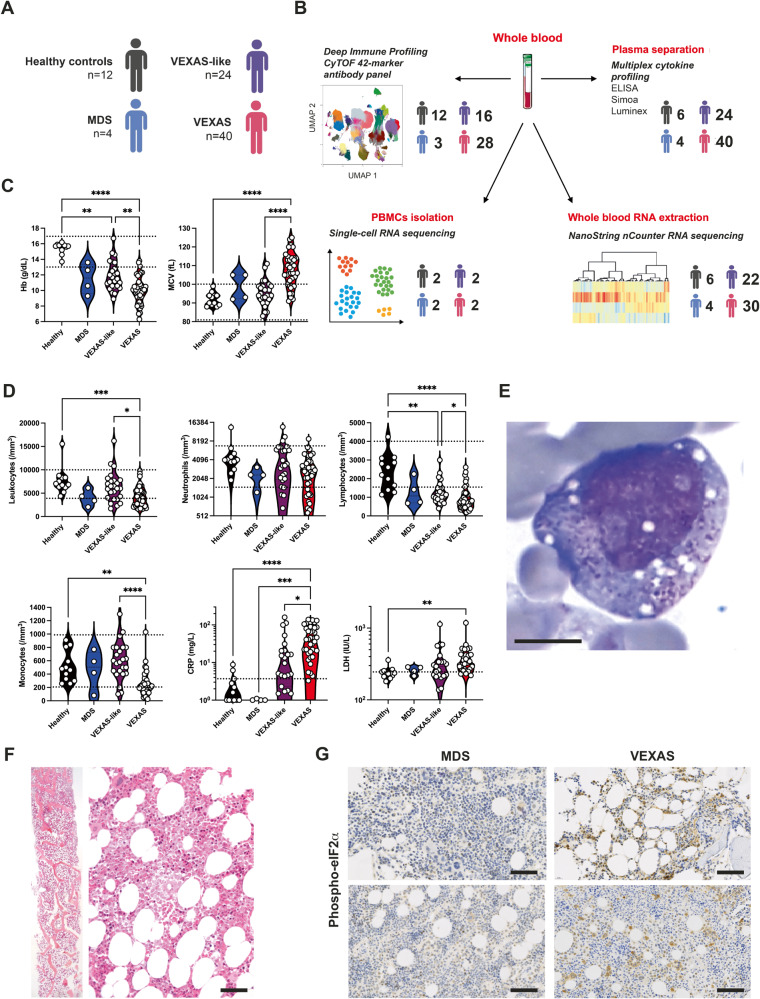
Fig. 1. Clinical and laboratory findings in patients with VEXAS syndrome, VEXAS-like, MDS and healthy controls.
A, B 40 individuals with VEXAS syndrome, 26 individuals with VEXAS-like, 4 with MDS and 12 aged gender-matched healthy controls were included, and samples were assessed using deep immune profiling, plasma multiplex cytokine profiling, whole blood RNA extraction and single-cell RNA sequencing. C Hemoglobin (Hb) and mean corpuscular volume (MCV) from patients with VEXAS syndrome, VEXAS-like, MDS and healthy controls (Hb, ****P < 0.0001, **P = 0.0068 and **P = 0.0048; MCV, ****P < 0.0001). Each dot represents a single patient. D Leukocytes, neutrophils, lymphocytes and monocytes count, C-reactive protein (CRP) and lactate dehydrogenase (LDH) from patients with VEXAS, VEXAS-like, MDS and healthy controls (leukocytes, ***P = 0.0008 and *P = 0.0202; lymphocytes, ****P < 0.0001, **P = 0.0049 and *P = 0.0163; monocytes, ****P < 0.0001 and **P = 0.0039; CRP, ****P < 0.0001, ***P = 0.0006 and *P = 0.0139; LDH, **P = 0.0017). Each dot represents a single patient. E Bone marrow aspiration showing vacuoles restricted to myeloid and erythroid precursor cells in a VEXAS patient (MGG staining, ×100, scale bar 10 μm). F Bone marrow biopsy from a VEXAS patient showing overrepresentation of the myeloid cell lineage with mature and immature forms (Magnification ×20, scale bar 100 μm). G Immunohistochemical staining of phosphorylated eIF2α on bone marrow biopsy from MDS and VEXAS patients, showing expression of p‑EIF2α only in VEXAS (Magnification ×20, scale bar 100 μm). P values were determined by the two-sided Kruskal-Wallis test, followed by Dunn’s post test for multiple group comparisons. *P < 0.05; **P < 0.01; ***P < 0.001, ****P < 0.0001.

