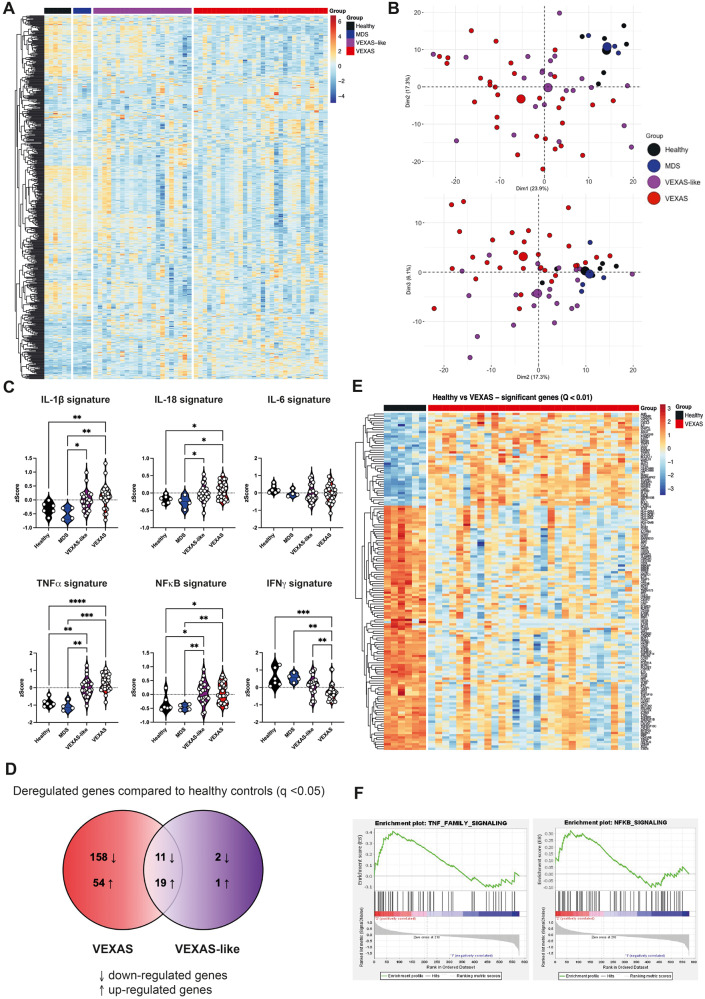
Fig. 5. Immunological transcriptional signatures in VEXAS syndrome.
A Heatmap representation of 579 immunological genes measured by Nanostring approach, ordered by hierarchical clustering in healthy controls (n = 6), MDS (n = 4), VEXAS-like (n = 23), and VEXAS (n = 29). B Principal component analysis of the transcriptional data according to the 4 groups of patients. Median values for each patients’ group are plotted with the large colored circle. C Comparison of IL-1β, IL-18, IL-6, TNF-α, NFκB and type II IFN gene signatures expression in healthy controls, MDS, VEXAS-like and VEXAS patients (IL-1β, **P = 0.007, **P = 0.0032 and *P = 0.0387; IL-18, *P = 0.0189, *P = 0.0107 and *P = 0.0491; TNF-α, ****P < 0.0001, ***P = 0.0002, **P = 0.0071 and **P = 0.0092; NFκB, **P = 0.0039, **P = 0.0058, *P = 0.0117 and *P = 0.0180; IFN-γ, ***P = 0.0010; **P = 0.0029 and **P = 0.0096). Each dot represents a single patient. D Venn diagram representation showing significant differential gene expression in VEXAS or VEXAS-like patients versus healthy controls. E Heatmap representation of differentially expressed genes (q-value < 0.01) in healthy controls (n = 6) and VEXAS (n = 29) patients, ordered by hierarchical clustering. F Gene set enrichment analysis of pathways enriched in VEXAS versus healthy controls, i.e., TNF-α signaling and NFκB signaling. P values were determined by the two-sided Kruskal-Wallis test, followed by Dunn’s post test for multiple group comparisons. *P < 0.05; **P < 0.01; ***P < 0.001, ****P < 0.0001.

