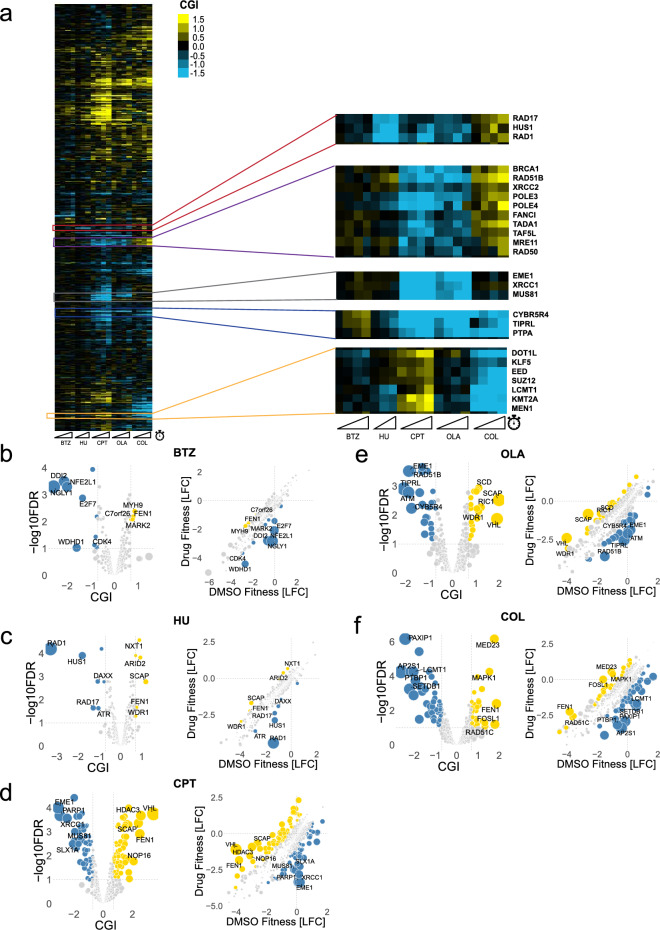
Figure 2.
Proof-of-principle scalable chemical screens recapitulate expected chemical-genetic interactions. (a) Heatmap of CGI values across five compound screens. Heatmap uses average-linkage hierarchical clustering on gene side (rows), while each column represents a compound at specific time points (sliding ramps represent increasing time points). Blue pixels represent negative CGIs, and yellow pixels represent positive CGIs (saturated at |CGI|= 1.5). Representative clusters are enlarged. (b–f) Left: Volcano plot of T12 screen for each compound screen (BTZ = bortezomib, HU = hydroxyurea, CPT = camptothecin, OLA = olaparib, COL = colchicine). Right: Scatterplot of control (DMSO) fitness vs. compound fitness, as represented by LFC values. Negative and positive chemical-genetic interactions (CGIs) are indicated in blue and yellow, respectively. Each point represents a gene. False discovery rate (FDR) values were calculated using the Benjamini–Hochberg method. Cutoffs for significant CGIs (hits) were set at FDR = 0.1 and |CGI|> 0.7 (gray dashed lines). The top five negative and positive hits are labeled.

