Figure 3.
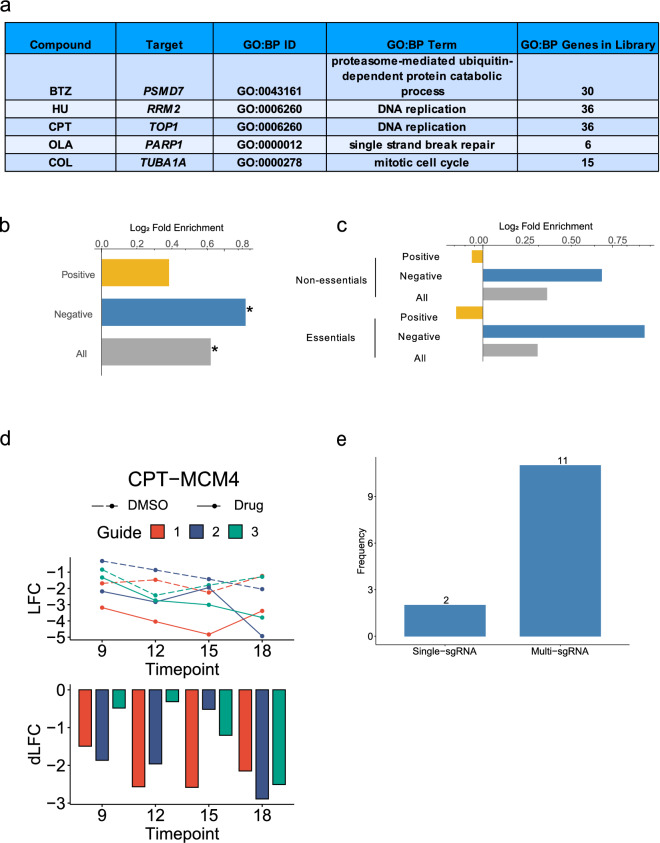
CGIs are enriched for compound MoA. (a) Table of screened compounds, gene target, Gene Ontology Biological Process (GO:BP) ID, GO:BP term that best represents compound MoA, and number of term-related genes found in the targeted library. (b) Enrichment of MoA related genes in compound CGI pairs. X-axis: log2 fold enrichment. All: all CGIs, Negative: negative CGIs only, Positive: positive CGIs only. * represents p-value < 0.05. (c) Enrichment of MoA- related genes in compound CGI pairs for essential and non-essential genes. (d) Top: Guide-level LFC line plots across time points for CPT-MCM4. Orange: sgRNA 1, blue: sgRNA 2, green: sgRNA 3. Dotted line: DMSO; solid line: compound. Bottom: Barplot of raw differential LFC (dLFC) score for each guide. (e) Barplot categorizing 13 essential gene—compound interactions. See “Methods” for categorization approach.

