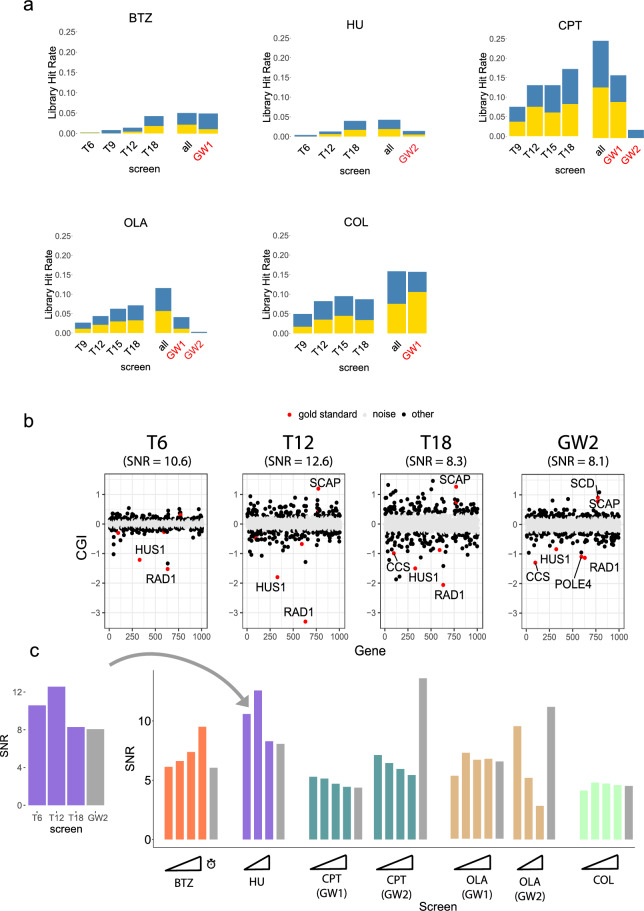
Figure 4.
Scalable chemical screens show comparable signal-to-noise ratio. (a) Barplots of library hit rate per screen. Blue represents negative CGI hits, yellow represents positive CGI hits. For each compound, a genome-wide screen was selected for comparison (see Table 1). Red label: genome-wide screen. GW1: genome-wide screen performed for this study. GW2: genome-wide screen from Olivieri et al. All: union of hits across all time points for a given screen. (b) Signal-to-noise ratio (SNR) dotplots for HU at T6, T12, T18, as well as corresponding genome-wide screen (HU2). Genes are arranged in alphabetical order from left to right, plotted against CGI score (y-axis). Points are divided into 3 categories: (1) gold standard hits (red dots), (2) background noise (gray dots), and (3) all other genes (black dots). (c) Barplot of SNR values for all screens. SNR is defined as the mean of CGI scores (signal) divided by standard deviation of the background noise. Gray: Genome-wide screens.

