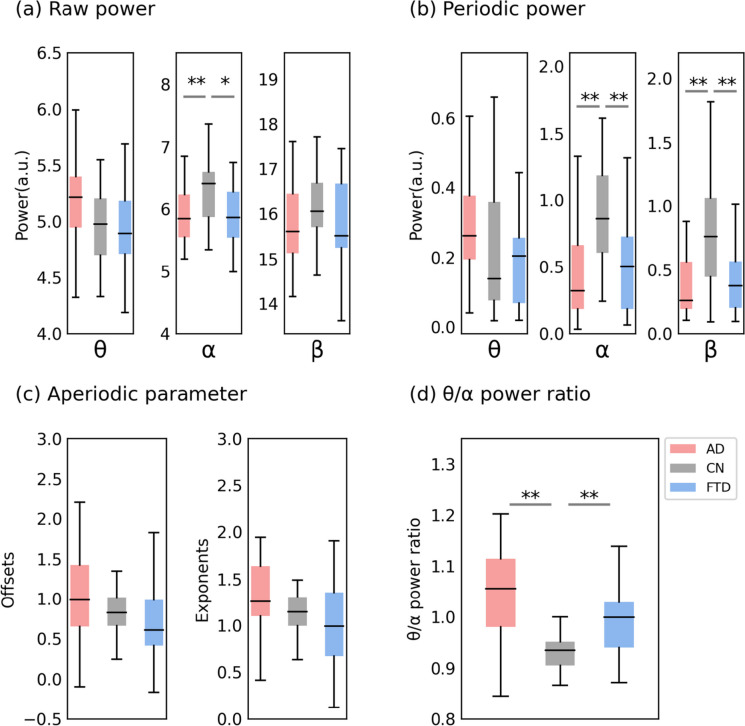
Fig. 3.
Channel-averaging results of the parameterized spectrum. a Group comparison of raw power. b Group comparison of periodic power. c Group comparison of aperiodic parameter. d Group comparison of θ/α power ratio. In each box plot, the center line corresponds to the median of the sample; the upper and lower borders of the boxes indicate the 25th and 75th percentiles, respectively; the length of the whiskers represents the range of the data. *p < 0.05, **p < 0.01. Corresponding results of the statistical comparisons between groups are shown in Table 2

