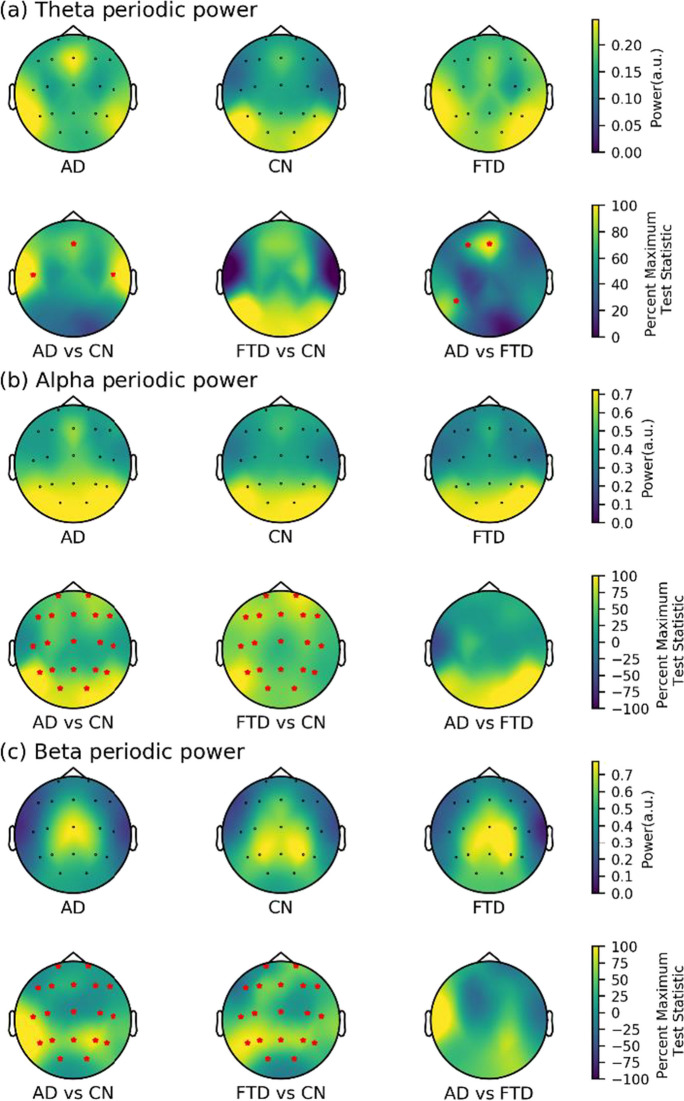
Fig. 5.
Scalp topography and group comparison for periodic power in three groups. a Theta periodic power. b Alpha periodic power. c Beta periodic power. All test statistics were rescaled and normalized to the percentage of the most significant test statistic for better visualization, such that 100 would reflect the most significant test statistic. All electrodes with significant test statistics (FDR-corrected p < 0.05) were marked with red stars. AD, Alzheimer’s disease; CN, healthy control; FTD, frontotemporal dementia; FDR, false discovery rate

