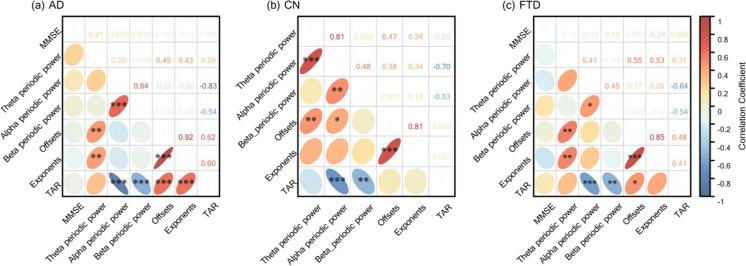
Fig. 8.
Spearman’s correlation between the severity of overall cognitive impairment (MMSE scores) and EEG parameterization results in three groups. a AD. b CN. c FTD. Statistically significant groups are marked by black asterisks on the lower left ellipse (FDR-corrected p-value, *p < 0.05, **p < 0.01, ***p < 0.001), and the transparent number on the upper right represents the correlation coefficient value. Also, the color of the ellipse maps the correlation coefficient value. AD, Alzheimer’s disease; CN, healthy control; FTD, frontotemporal dementia; TAR, theta alpha power ratio; MMSE, Mini-Mental State Examination; FDR, false discovery rate

