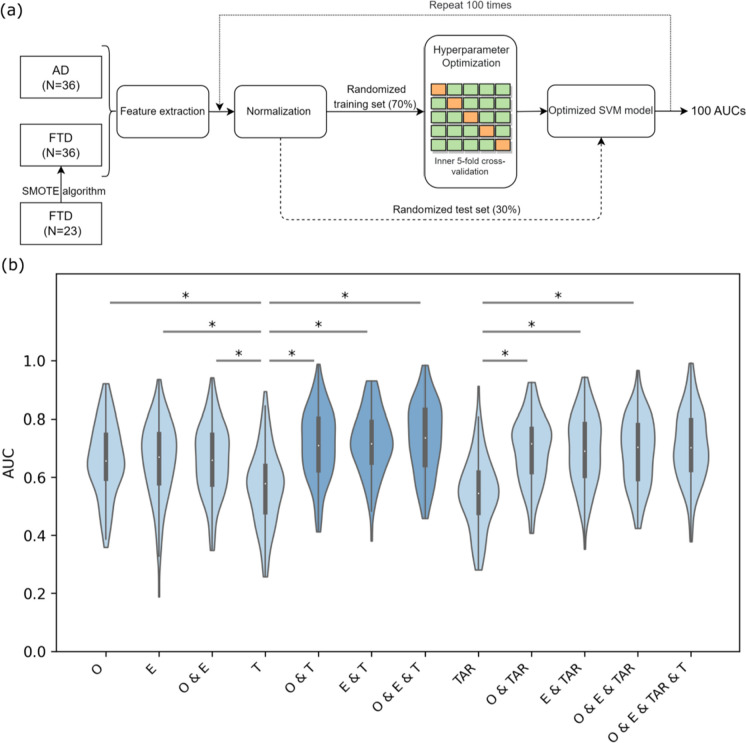
Fig. 9.
Schematic diagram of the SVM model and AUC results. a Pipeline for training and evaluation of SVM models. Feature combinations were extracted from the total dataset (AD group, N = 36; FTD group, N = 36 (data over-sampling)), then normalized and divided into training and test sets in the ratio of 7:3. Hyperparametric optimization was performed in the training set using inner fivefold cross-validation to obtain the best SVM model, and the test set was used to evaluate the performance of the optimized SVM model. Finally, the whole procedure was repeated 100 times using different random training and test sets. Posterior probabilities were calculated to obtain ROC curves and AUC values. b Group comparison of AUC values in different feature combinations. In each violin plot, the white dot in the center corresponds to the mean of the sample; the upper and lower boundaries of the boxes indicate the 25th percentile and 75th percentile, respectively; the length of the whiskers represents the range of the stated data. *p < 0.001. Violin diagrams with the top 3 AUC values are represented in a darker color. Only partially significantly different comparative results are presented in the figure, corresponding results of all statistical comparisons between different feature combinations are shown in Supplementary Table S3. AD, Alzheimer’s disease; FTD, frontotemporal dementia; SVM, support vector machine; ROC, receiver operating characteristic; AUC, area under curve; O, offsets; E, exponents; T, theta raw power; TAR, theta alpha power ratio

