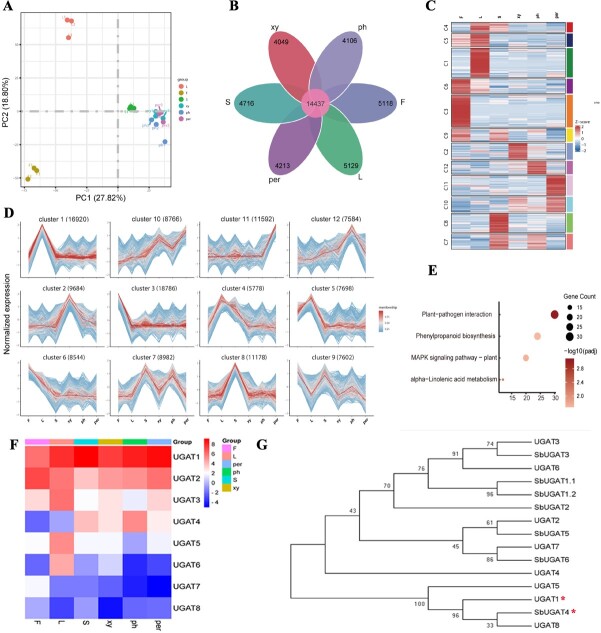
Figure 3.
Transcriptomic profiling of tissue from flower, leaf, stem, phloem, xylem, and periderm in S. baicalensis. A PCA result of all genes obtained from RNA sequencing of samples tissues, where each dot represents the combined expression data for all genes from a single tissue sample. B Venn diagram of the number of genes that are uniquely expressed within each group and co-expressed in multiple groups. C Differential expression gene clustering heat map produced by the Mfuzz R package. All genes with significantly altered expression (threshold of |log2(FoldChange)| ≥ 1, Padj ≤ 0.05) are displayed and clustered using the log2(FPKM + 1) value. Color ranging from red to blue indicates log2(FPKM + 1) values ranging from large to small. D Overall cluster results of FPKM analysis using the log2(FPKM + 1) value. E KEGG pathways of genes from cluster 10 matrix (Padj ≤ 0.05) based on gene expression differences across six tissues. F Expression pattern of UGAT from the transcriptomic database of S. baicalensis. G Phylogenetic tree analysis of UGAT protein sequences. Neighbor-joining was employed to construct this tree with 1000-replicate bootstrap. The gene loci of SbUGAT1.1, SbUGAT1.2, SbUGAT2, SbUGAT3, SbUGAT4, SbUGAT5 and SbUGAT6 are Sb01g50771.p1, Sb01g50771.p2, Sb01g50791, Sb01g51711, Sb01g56811, Sb01g56821 and Sb09g13460.

