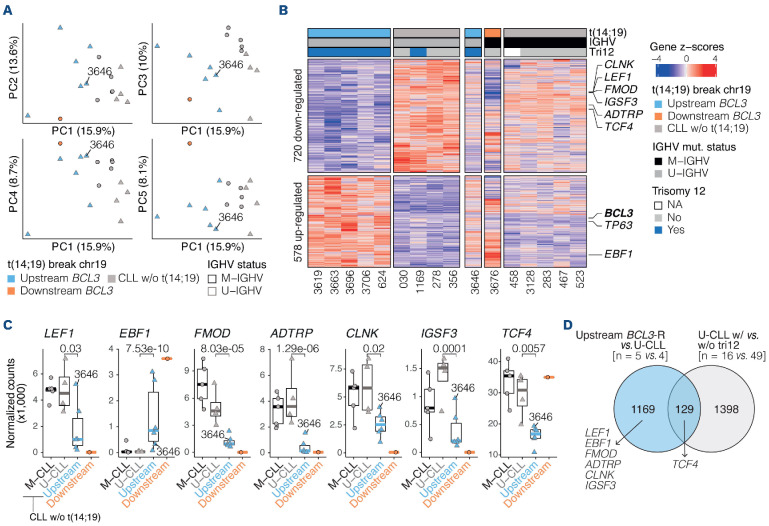
Figure 4.
Gene expression profile of upstream tumors with BCL3 rearrangement. (A) Principal component analysis of RNA sequencing data of 6 upstream BCL3 rearrangement (BCL3-R) tumors, 1 downstream BCL3-R tumor, and 9 chronic lymphocytic leukemia (CLL) (1st component is shown against 2nd, 3rd, 4th and 5th components). (B) Heatmap of the differential gene expression analysis between 5 upstream BCL3-R tumors and 4 unmutated CLL (U-CLL), also compared to 1 tumor with downstream BCL3-R tumor and CLL without t(14;19). Tumor 3646 was excluded from the analysis due to its subclonal BCL3-R. Hallmark CLL genes differentially expressed between BCL3-R tumors and CLL are flagged. (C) Expression of CLL hallmark genes in the upstream BCL3-R tumors compared to U-CLL. Q-values are from the differential gene expression analysis. (D) Venn diagram showing the overlap of the differentially expressed genes among upstream BCL3-R versus U-CLL and U-CLL with versus without trisomy 12. Hallmark CLL genes are highlighted. IGHV: variable region of the immunoglobulin heavy chain gene; M-IGHV: mutated IGHV; U-IGHV: unmutated IGHV; NA: not available; M-CLL: mutated CLL; w/o: without.

