
Figure 4.
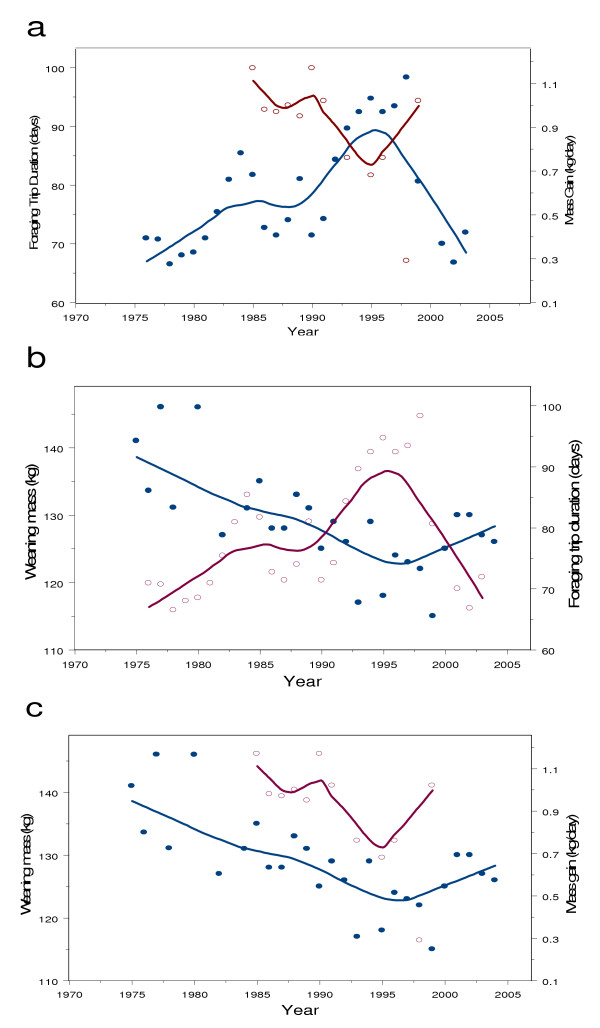
Foraging effort and foraging success of adult females. a) Loess plots of foraging trip duration of females (blue line, closed circles) show an inverse relationship with mass gain at sea (red line, open circles). b) A Loess plot shows that weaning mass (blue line, closed circles) is inversely related to foraging trip duration of females (red line, open circles). c) Weaning mass (blue line, closed circles) covaries with mass gain of adult females (red line, open circles).