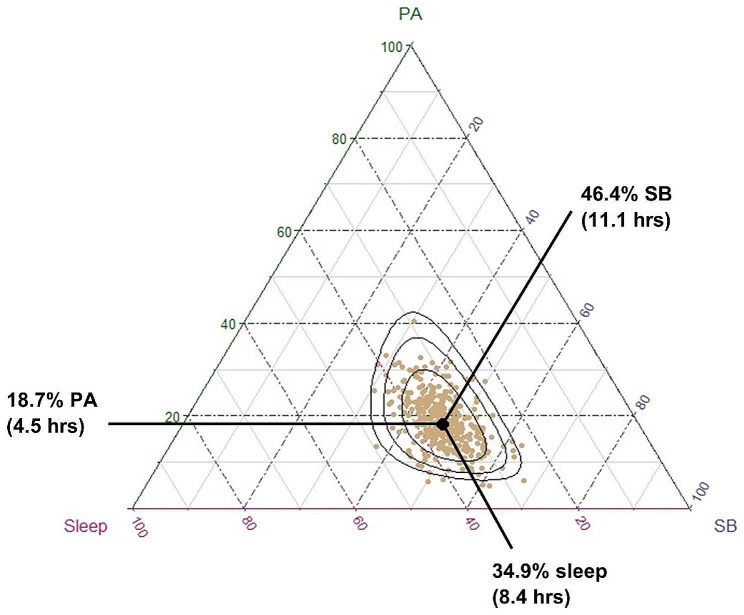
Fig. 1.
Distribution of participants’ time-use compositions. Each gold dot represents a single participant’s 24-hour time-use composition, whereas the black dot represents the average time-use composition of the entire sample (calculated as the compositional mean). On average, participants spent 18.7% of their day in physical activity (moderate-vigorous and light intensity, summed), 34.9% of their day in sleep, and 46.4% of their day in sedentary behaviour. Black ellipses represent 75%, 95% and 99% density contours assuming compositional normality (normal distribution on the simplex [46]

