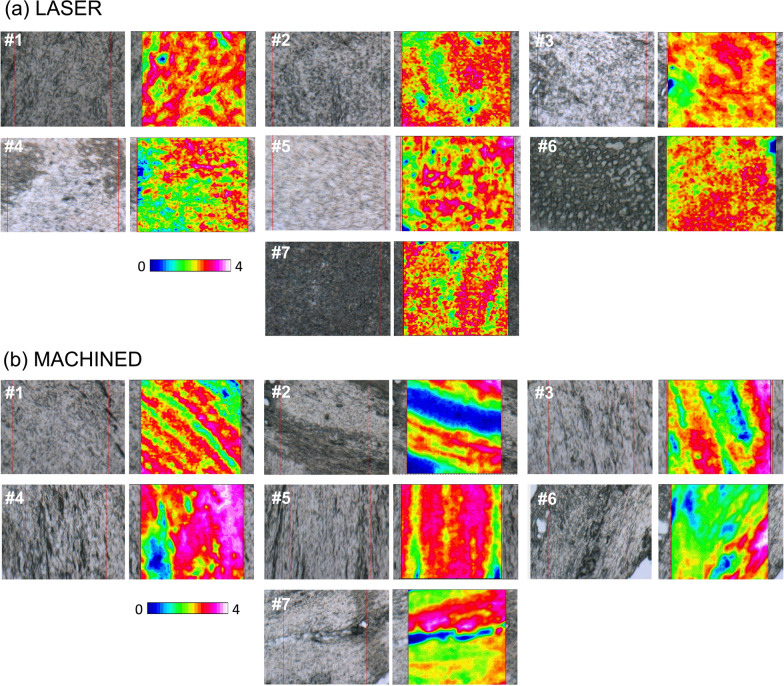
Fig. 5.
Hyperspectral analysis of the IR images collected on gingival portions adjacent to (a) laser-treated (LASER) and (b) machined (MACHINED) surfaces. For each patient (#1–#7), the photomicrographs of representative LASER and MACHINED areas are reported (on the left), together with the false color images showing the topographical distribution of collagen (on the right). The red squares in the photomicrographs indicate the areas on which IR images were collected (164 × 164 μm2; 4096 pixel/spectra; spatial resolution 2.56 × 2.56 μm2). An arbitrary colored scale was adopted, white/pink colors indicating areas with the highest amount of collagen, while blue/black colors those with the lowest one

