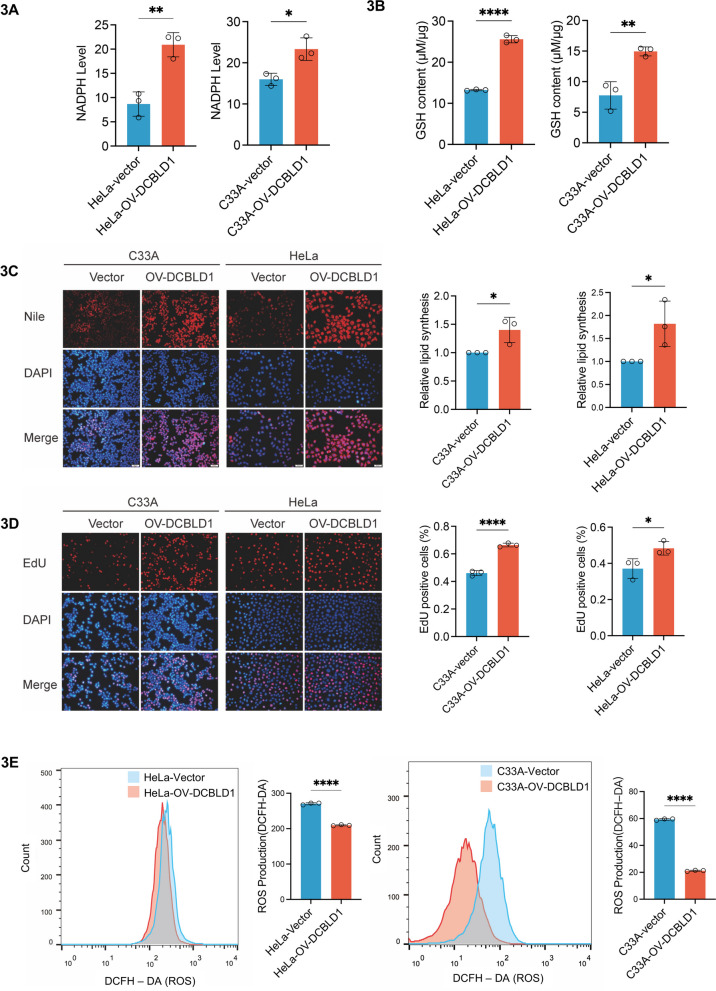
Fig. 3.
DCBLD1 overexpression activates the PPP. A, B Intracellular NADPH and GSH levels were measured in HeLa and C33A cells expressing either the vector or OV-DCBLD1. C Lipid synthesis detection using Nile Red staining. Representative images (left) and the average fluorescence quantification results (right) are shown. D DNA synthesis in HeLa and C33A cells expressing the vector or OV-DCBLD1 was determined using EdU. EdU-positive cell proportion was analyzed using ImageJ. Representative images (left) and the quantification results (right) are shown. E DCFH-DA was used to examine ROS in the cytoplasm of HeLa and C33A cells. Representative images obtained through flow cytometry are shown (left), with corresponding histograms presented on the right side. Data are shown as mean ± SD. Statistical significance was assessed using an unpaired t test (A-E). (****, p < 0.0001; **, p < 0.01; *, p < 0.05). Scale bar: 50 µm

