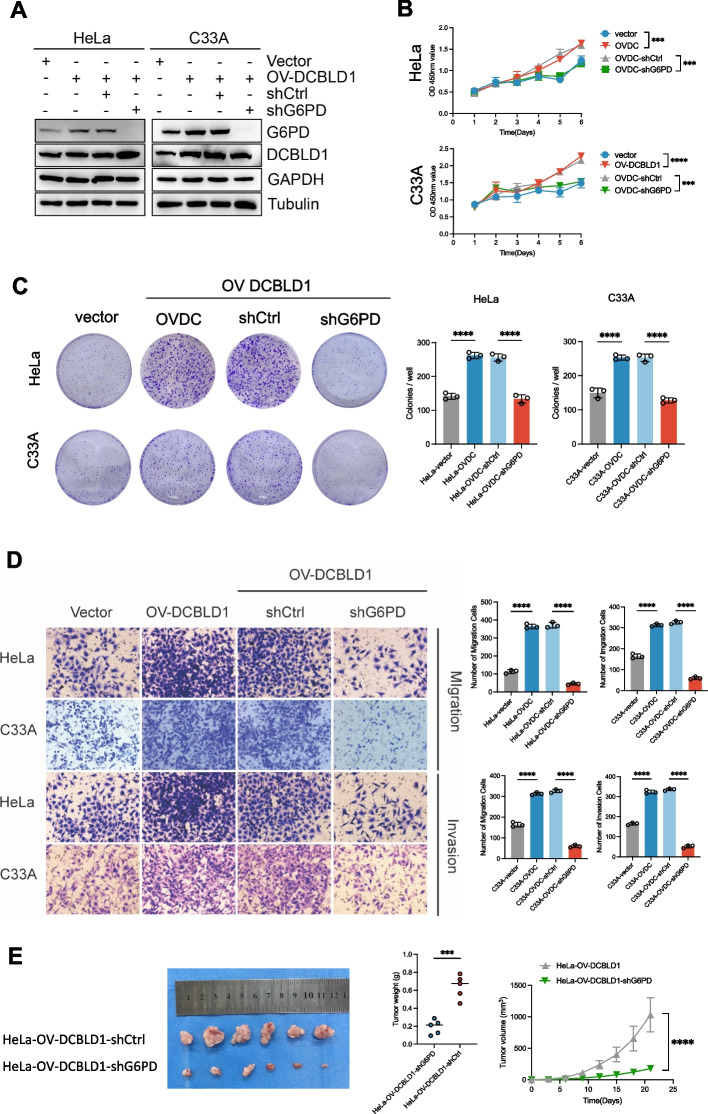
Fig. 6.
G6PD knockdown blocks DCBLD1-induced increases in cell proliferation, migration, and invasion. A Immunoblotting was used to detect DCBLD1 and G6PD levels in cell lysates. GAPDH was used as a loading control. B Cell viability was determined using CCK8 assays. C Cell proliferation rate was determined using clone formation assay. D Transwell migration and invasion assays were performed on HeLa and C33A cells, stably expressing vector, OV-DCBLD1, OV-DCBLD1-shCtrl, and OV-DCBLD1-shG6PD. E Xenograft tumor images derived from HeLa cells. n = 6 mice per group. Tumor growth curves of the different groups. Weight of the excised tumors in each group. Data are presented as mean ± SD. Statistical significance was assessed using a one-way ANOVA with the Brown-Forsythe test (B, C, and D) or an unpaired t test (E). (****, p < 0.0001; ***, p < 0.001). Scale bar: 50 µm

