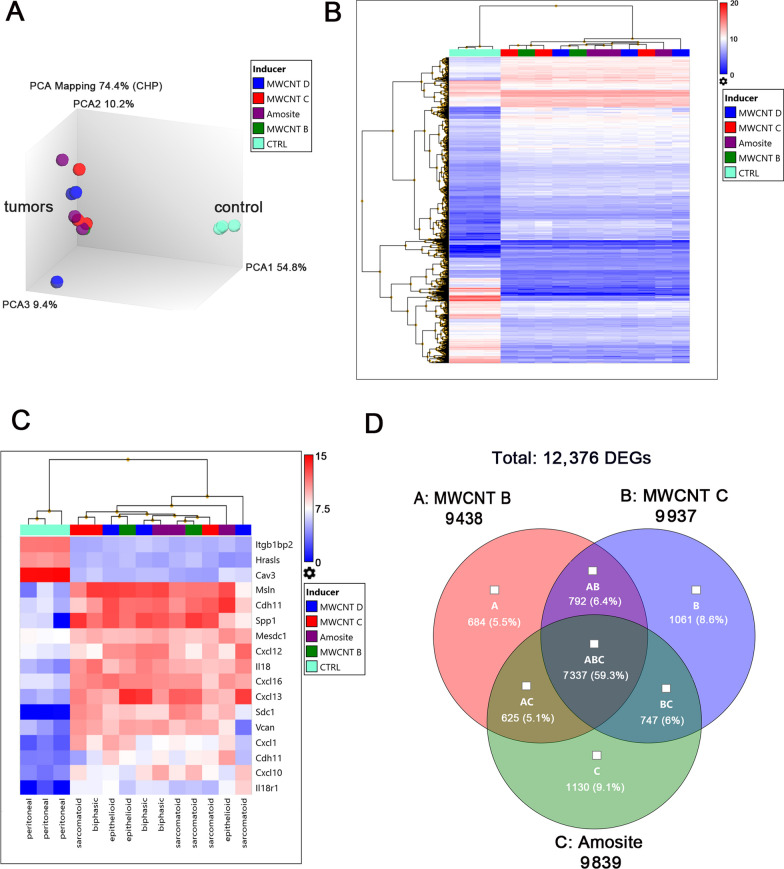
Fig. 1.
Transcriptome profiling of tumors induced by MWCNTs and amosite asbestos. A Principal component analysis (PCA) shows clear separation of tumors from the control peritoneal tissues. B Unsupervised hierarchical clustering analysis and heat map of 3062 filtered genes at fold change < − 2 or > 2, ANOVA P < 0.001, and FDR P < 0.001. C Hierarchical clustering and heat map on a few selected genes encoding for proteins such as mesothelin, osteopontin, caveolin, integrin, syndecan, chemokine, and interleukin. D Venn diagrams display the quantity of genes that are common and unique among the datasets of MWCNT B, MWCNT C, and amosite asbestos. The genes in the Venn diagrams were filtered using fold change < − 2 or > 2, ANOVA P < 0.05, and FDR P < 0.05. Quality control criteria and bioinformatics tools were according to Transcriptome Analysis Console (TAC 4.0.2, Thermo Fisher Scientific)

