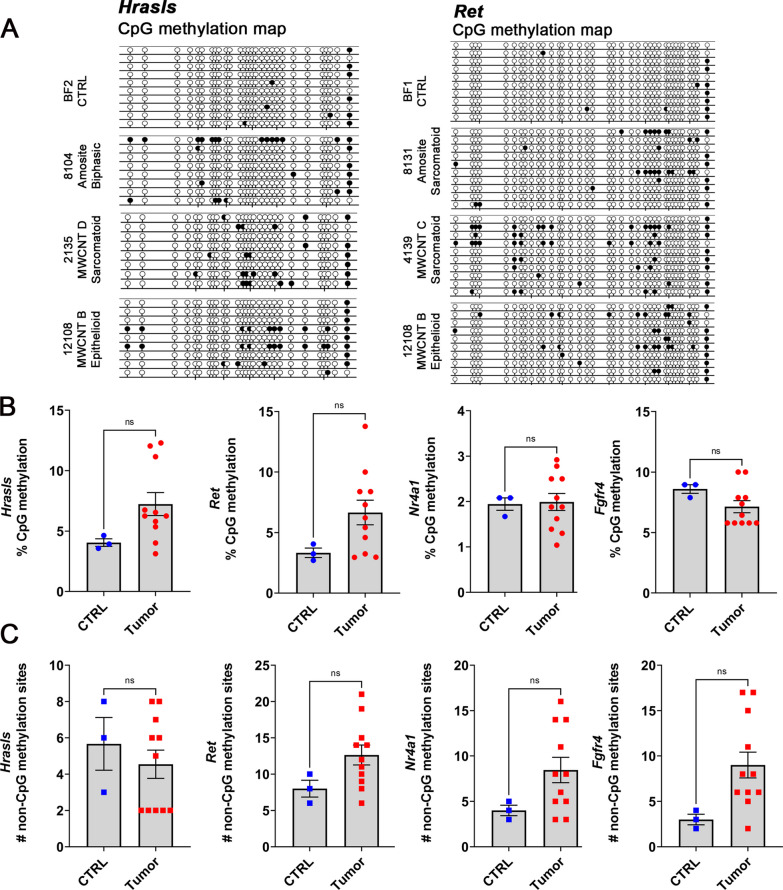
Fig. 7.
DNA methylation in the promoter regions of genes that are downregulated in tumors induced by MWCNTs or amosite asbestos. A Examples of CpG methylation maps for the Hrasls and Ret genes obtained after Sanger bisulfite sequencing. Shown are methylation patterns of 8–10 sequenced clones from both control and tumor tissues. Methylated CpGs (filled lollipops); Unmethylated CpGs (unfilled lollipops). B, C Percent CpG methylation and the number of non-CpG methylation sites in 3 control and 11 tumor tissues in Hrasls, Ret, Nr4a1, and Fgfr4. Scatter dot plots and statistical results were obtained using GraphPad Prism 9. Statistical significance was determined at P < 0.05, t–test for unpaired values, two-tailed. Bar depicts mean and standard error of the mean (SEM)

