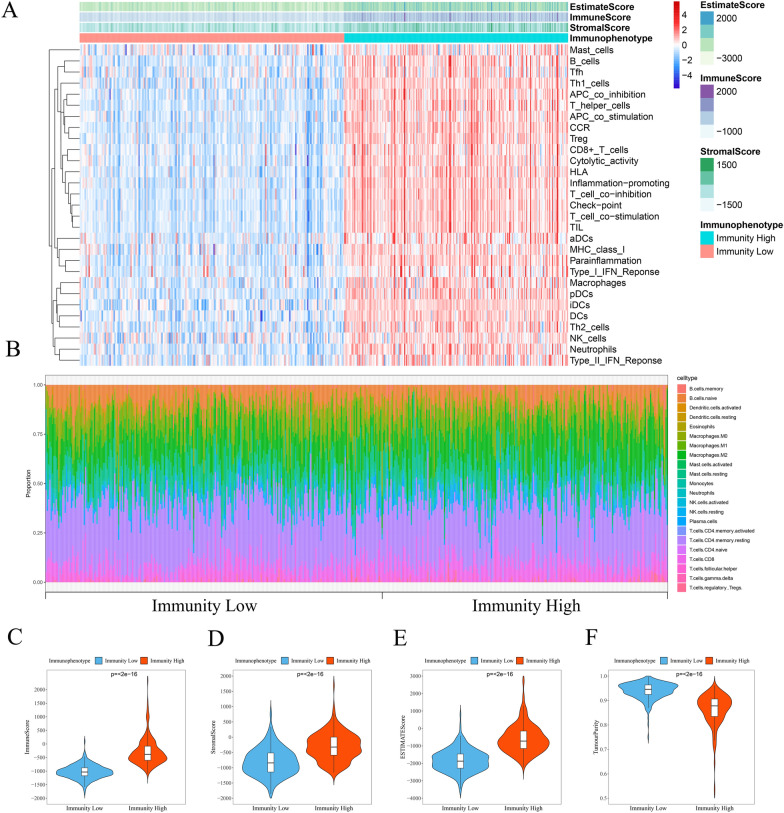
Fig. 2.
The tumor microenvironment and immunophenotype of patients with PCa in the TCGA cohort. A The ssGSEA algorithm and hierarchical cluster analysis were used to determine the immune characteristics and tumor microenvironment landscape of PCa patients. B Differences in the infiltration of 22 immune cells between the low-immunity and high-immunity groups were determined based on the CIBERSORT algorithm. The violin plot displays the ImmuneScore (C), StromalScore (D), EstimateScore (E), TumourPurity (F) between the low-immunity and high-immunity groups

