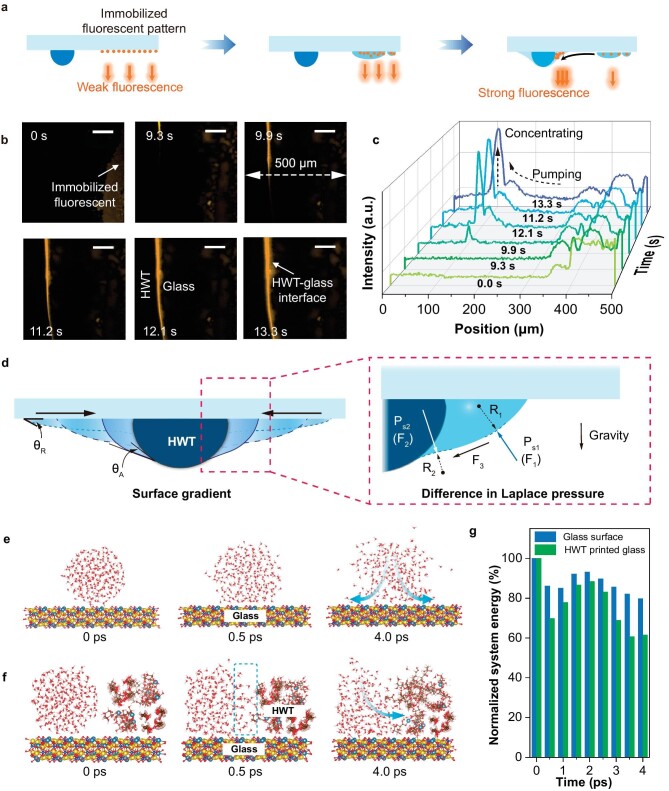
Figure 2.
The directional pumping effect of water molecules at the HWT–glass interface. (a) Schematic illustration of the method used to detect the pumping effect of HWTs. Pre-dipped fluorescent molecules enable the tracing of water molecule movement and increase detection sensitivity. The orange straight arrows represent the fluorescence. (b) Fluorescence signals before and after condensation illustrate the directional pumping of water molecules from the glass surface to the HWT (scale bar: 100 μm). (c) Average fluorescence intensity vs. position at various times after condensation. (d) Surface energy gradient and difference in Laplace pressure (inset) between the glass and the HWT. The black solid arrows indicate the direction of the induced pumping effect. MD simulations of water molecule motion over (e) a silicate glass control and (f) an HWT-printed glass surface. (g) The decrease of system energy during motion of the water molecules.

