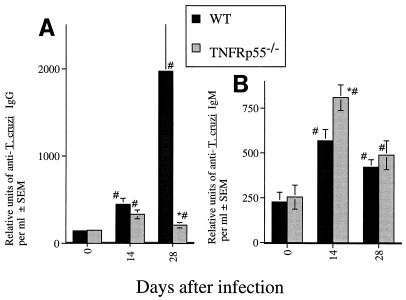
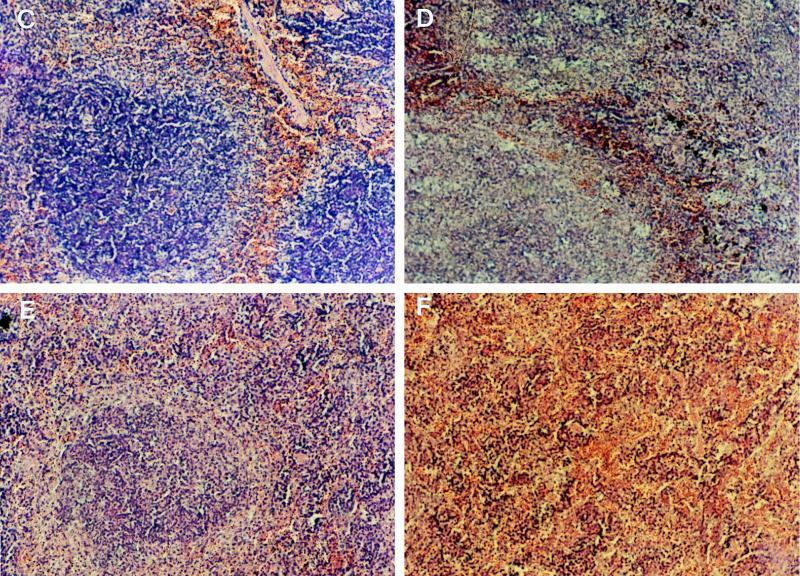
FIG. 4.
(A and B) Titers of anti-T. cruzi IgG (A) and IgM (B) in sera from individual mice (six mice per group) at 17 and 28 days after infection with strain CA-I. The mean numbers of arbitrary units of specific IgG and IgM per milliliter obtained from one of two independent experiments are depicted. ∗, significantly different from values for WT infected mice (P < 0.05, F-test, analysis of variance). #, significantly different from values for uninfected WT or TNFRp55−/− controls (P < 0.05, F-test, analysis of variance). (C to F) Hematoxylin-eosin staining of spleen tissue sections from WT (C and D) and TNFRp55−/− mice (E and F) at 0 (C and E) or 15 (D and F) days after infection with T. cruzi. It is important to note the lack of primary follicles (E) and germinal center formation (F) in tissues from uninfected or infected TNFRp55−/− mice.


