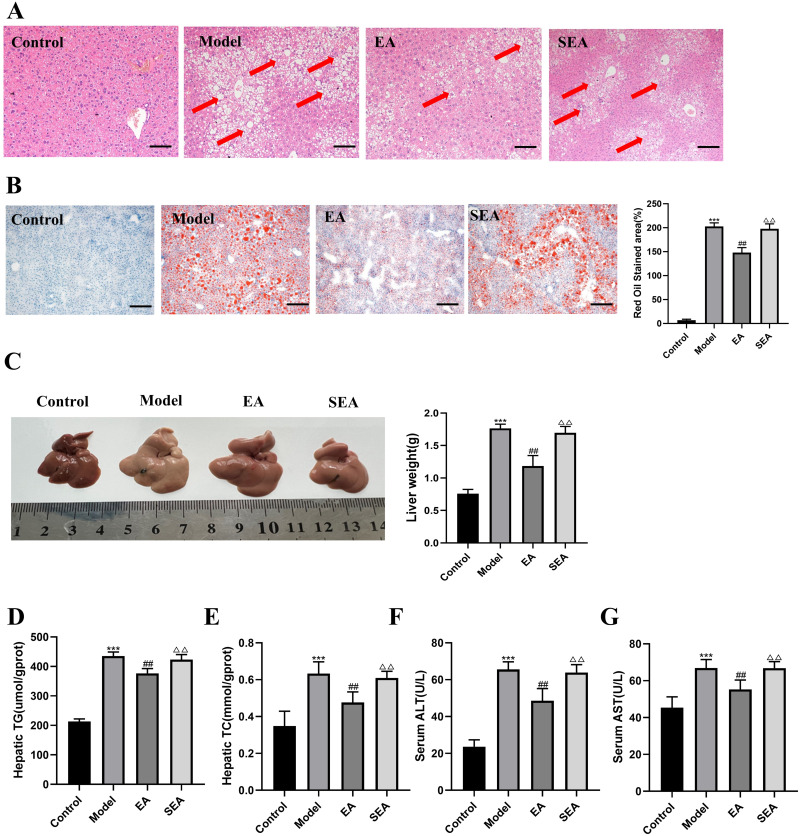
Figure 2.
EA improves liver steatosis and liver function in mice (A) H E staining of liver tissue (scale bar = 200 µm). The red arrows indicate typical hepatic inflammation. (B) Liver tissue stained with Oil Red O (scale bar = 200 µm). (C) Morphology of liver. (D) Hepatic TG. (E) Hepatic TC. (F) Serum ALT. (G) Serum AST. n= 6, values are mean ± SEM; *** p < 0.001 (Control vs Model); ## p < 0.01 (Model vs EA); ΔΔ p < 0.01 (EA vs SEA).

