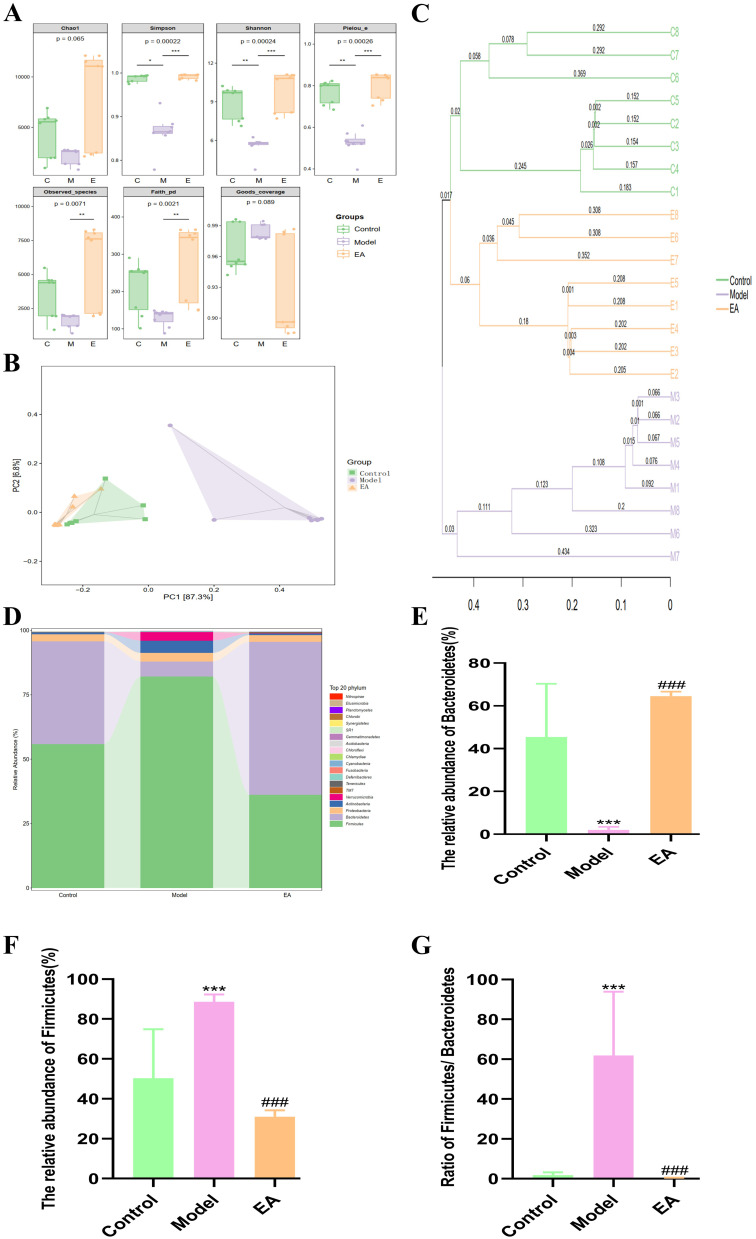
Figure 6.
Effect of EA on gut microbiota of mice with high-fat diet (A) Alpha diversity index. (B) PCoA analysis. (C) UPGMA analysis. (D) Species group at phylum level. (E) The relative abundance of Bacteroidetes.(F) The relative abundance of Firmicutes (G)The ratio of Firmicutes to Bacteroidetes. n = 8, values are mean ± SEM; * (Control vs Model), *p < 0.05, ** p < 0.01,*** p < 0.001; ### p < 0.01 (Model vs EA).

