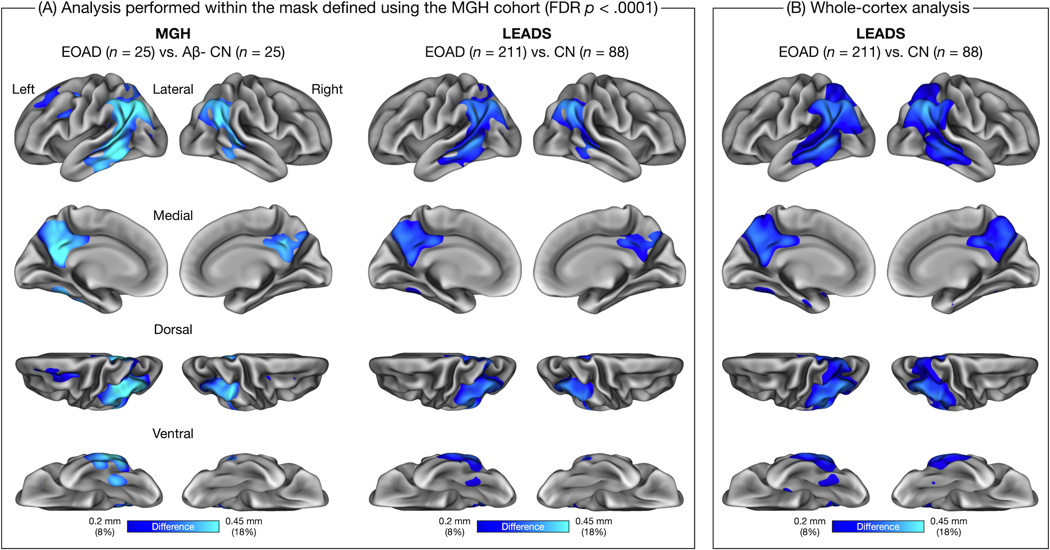
Figure 1. Spatial topography of the early-onset Alzheimer’s disease (EOAD) signature across two independent cohorts.
(A) Colored vertices on the cortical surface maps indicate areas where patients with EOAD showed cortical atrophy compared to low-amyloid cognitively normal (CN) participants within each cohort. These group difference (“gamma”) maps were thresholded at 0.2 mm, corresponding to an ≈8% reduction in cortical thickness relative to the pooled sample of CN participants. Because the Massachusetts General Hospital (MGH) and longitudinal early-onset Alzheimer’s disease study (LEADS) cohorts differed substantially in sample size, which would influence the statistical significance of effects, we masked both group difference maps by a vertex-wise map representing areas showing statistically significant group differences in the MGH cohort (assessed at P < 0.0001, false discovery rate (FDR)-corrected). (B) Colored vertices on the cortical surface map indicate areas where LEADS EOAD patients showed cortical atrophy relative to LEADS CN participants. This map was generated similarly to the map shown in (A), but without the FDR-corrected mask derived from the MGH cohort. This map (B) demonstrates the specificity of the EOAD signature in the LEADS replication cohort compared to the MGH discovery cohort (A).

