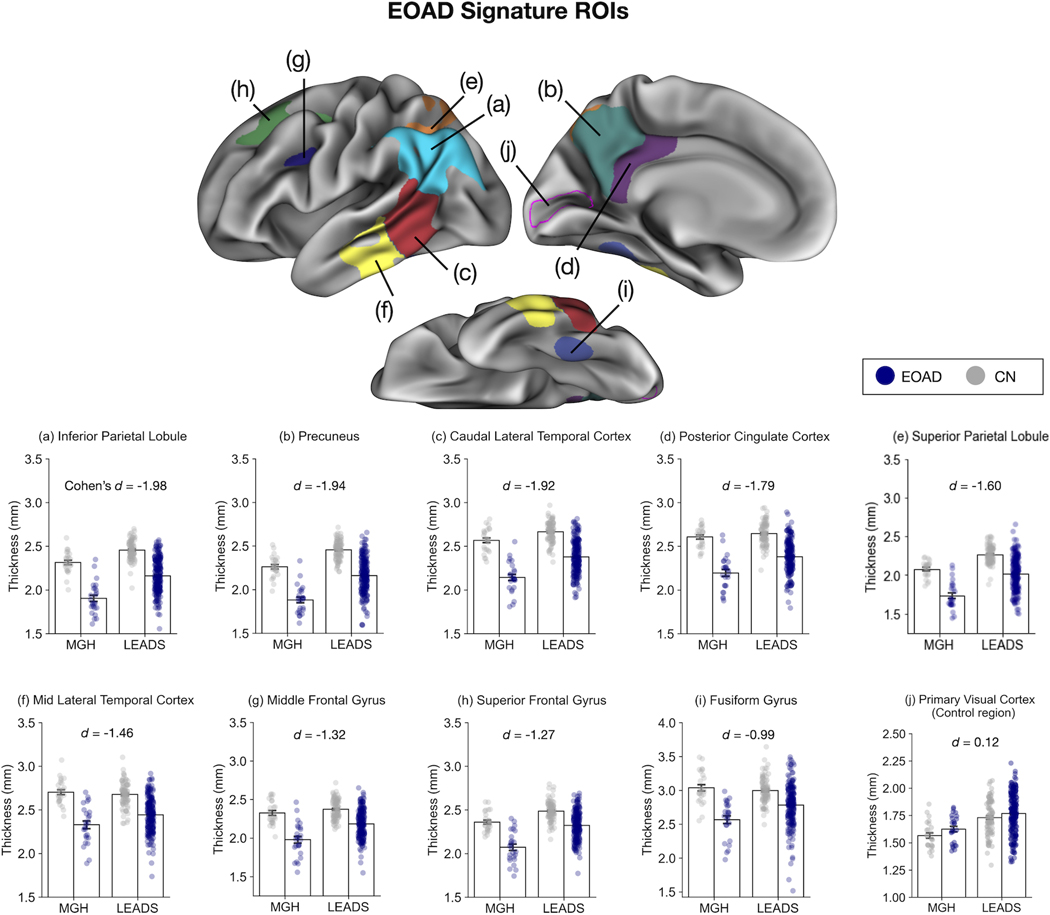
Figure 2. Consistency of regional cortical atrophy in early-onset Alzheimer’s disease (EOAD).
Our EOAD-signature regions of interest (ROIs) (top) were generated from a vertex-wise general linear model analysis of cortical thickness data in the Massachusetts General Hospital (MGH) cohort. The same ROIs were applied to the longitudinal early-onset Alzheimer’s disease study (LEADS) cohort to test the hypothesis that these regions are thinner in EOAD than cognitivevly normal (CN) controls. Bar plots at the bottom show mean cortical thickness within each ROI across the two cohorts, illustrating the consistency of cortical thickness. Error bars denote one standard error of the mean. Each colored circle overlaid on top of the bar plot represent one participant. Primary visual cortex (pericalcarine ROI; indicated by the magenta outline) was used as a control region to illustrate absence of effects in this region. ROIs are presented above in descending order of effect size (Cohen’s d). Cohen’s d values shown here were calculated by first computing the effect size estimate for each cohort and taking the weighted average of the two cohorts accounting for their sample sizes. See Table 2 for cohort-specific effect sizes along with other relevant statistics.

