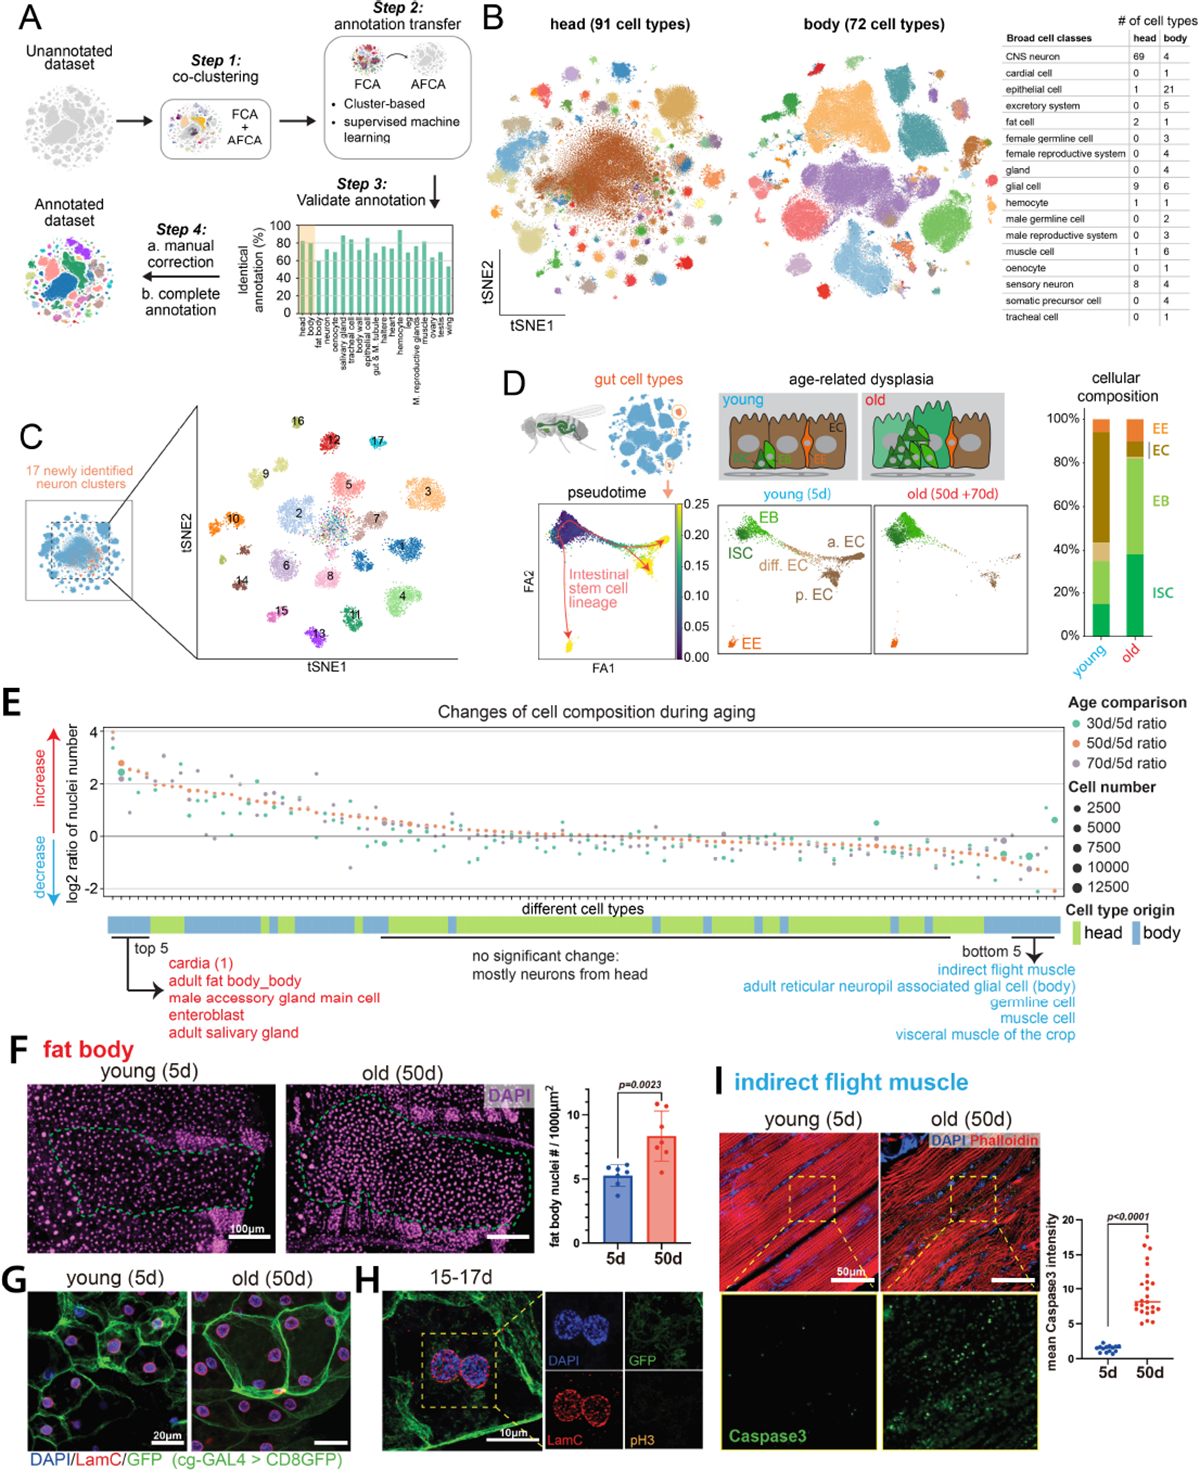
Figure 2. AFCA resource and changes of cell composition during aging.

A) Flowchart of transferring annotations from FCA to AFCA.
B) Cell types annotated in the AFCA head and body shown on tSNE. The number of annotated cell types corresponding to the broad cell classes is shown in the table.
C) Identification of 17 new neuronal clusters after combining AFCA and FCA head data.
D) Pseudotime and cellular composition of ISC and ISC-differentiated cell types. ISC, intestinal stem cell; EB, enteroblast; EC, enterocyte; EE, enteroendocrine cell; a. EC, anterior EC; p. EC, posterior EC; diff. EC, differentiating EC.
E) Changes of cellular composition during aging. Each dot represents one cell type. Each color compares one aged sample and the 5d sample. Dot sizes reflect the nuclear numbers of the corresponding cell type from the aged population. Tissue origins are indicated.
F) Comparison of the number of nuclei of the fat body from young and old flies. Nuclei are stained by DAPI and counted in each fly. The nuclear number is significantly increased in the 50d population (t-test, 50d vs. 5d, P value=0.0023). Error bar, standard deviation (SD).
G) Representative confocal images showing nuclei in young and old fat body cells. The membrane is labeled by cg-GAL4 > UAS-CD8GFP. Nuclei are stained by DAPI and the LamC antibody.
H) Fat body cells with segregating nuclei stained by pH3, DAPI, LamC, and GFP.
I) Indirect flight muscle stained with cleaved-Caspase3 antibody, DAPI, and Phalloidin. CleavedCaspase3 signals are significantly increased in the aged population (t-test, 50d vs. 5d, P value<0.0001). Median numbers indicated.
