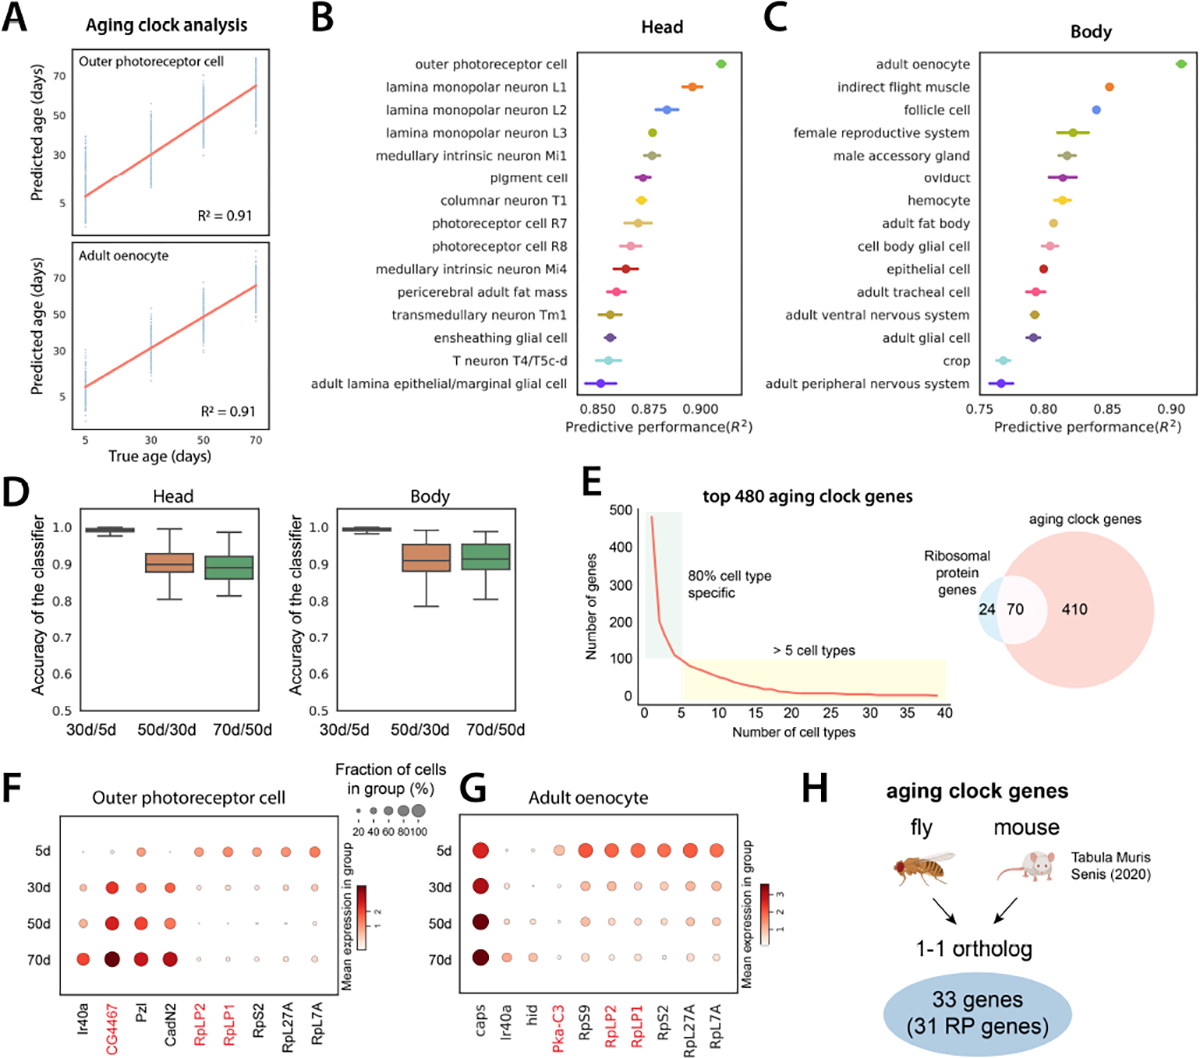
Figure 4. Aging clock analysis.

A) Example of aging clocks for outer photoreceptor cells and adult oenocytes. Redline is the fitted regression line. Blue dots represent individual predictions where each dot corresponds to one cell. We measure performance as the proportion of the variance for an age variable that’s explained by transcriptome (R2).
B, C) Predictive performance of cell type-specific aging clocks for head and body cell types. 15 cell types with the highest scores are shown. Error bars are estimated as a SD over 5 runs.
D) Accuracy of logistic regression models trained to distinguish transcriptome between two consecutive time points. Boxplots show the distribution across head cell types (left) and body cell types (right).
E) Number of aging clock genes as a function of the number of cell types (left). 80% of genes appear in less than 5 cell types. Out of 480 genes identified as aging clock genes, 70 encode RP genes (right).
F-G) Examples of aging clock genes for outer photoreceptor cell F) and adult oenocyte G). Cell type-specific genes that appear in less than 5 cell types are shown in black color, while genes that appear in at least 5 cell types are marked in red color.
H) Aging clock genes identified in flies and mice. 33 genes are 1–1 orthologs between the two species, and 31 of these are RP genes.
