
Figure 2.
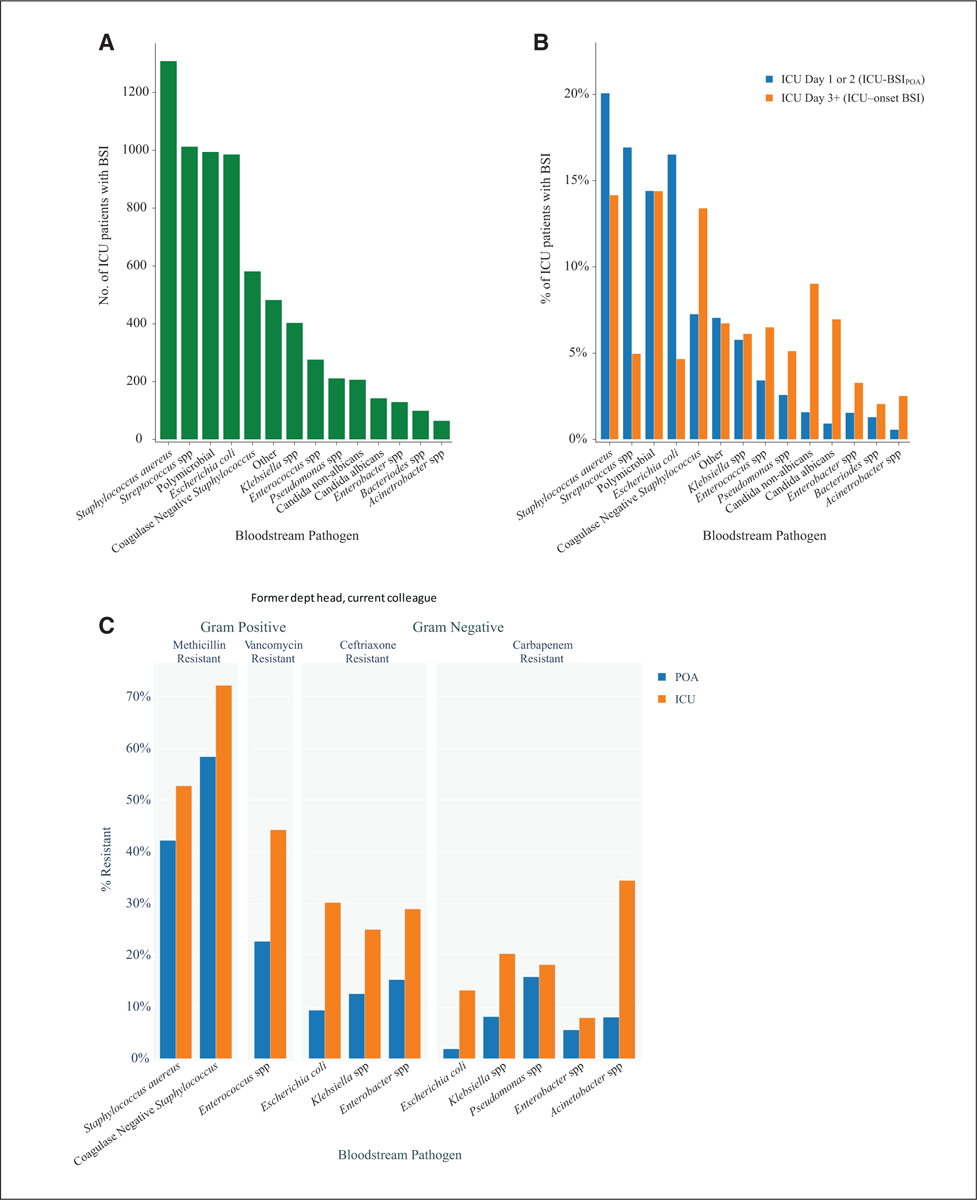
Distribution of bloodstream pathogens among ICU patients. A, The distribution of bloodstream pathogens across all ICU patients with bloodstream infection (BSI) (green bars). B, The percentage distributions of bloodstream pathogens separately for BSI present on (ICU) admission (ICU-BSIPOA) (blue bars) and BSI acquired in the ICU (ICU-onset BSI) (orange bars), respectively, and displayed as paired graphs to enable visual comparisons. C, The distribution of bloodstream pathogens according to resistance profile separately for ICU-BSIPOA (blue bars) and ICU-onset BSI (orange bars), respectively.