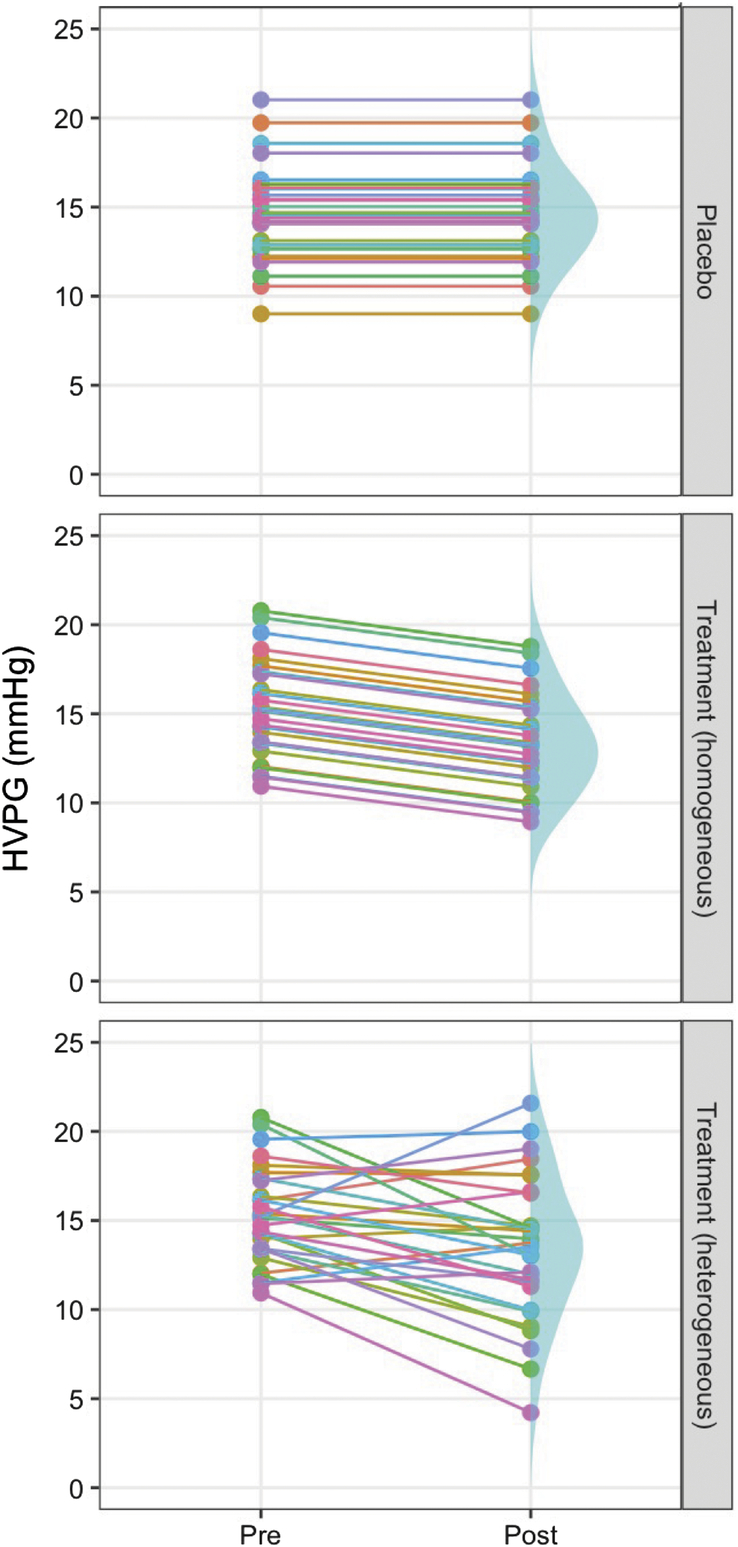
FIGURE 1.

Illustration of the concept of increased variability in the outcome measure with a heterogeneous treatment response. A homogeneous effect assumes the same effect occurred in all patients and thus, the lines in the middle panel are parallel. In this case, the HVPG variability at the end of the study (represented by the blue distribution) is comparable between the treatment group and the placebo group. If the treatment induces a heterogeneous response, the lines are no longer parallel (lower panel), and the variability of the HVPG at the end of the study would be greater in the treatment group as compared with the control group. Further details and a more thorough data simulation are provided in Supplemental Data 1, http://links.lww.com/HC9/A657.
