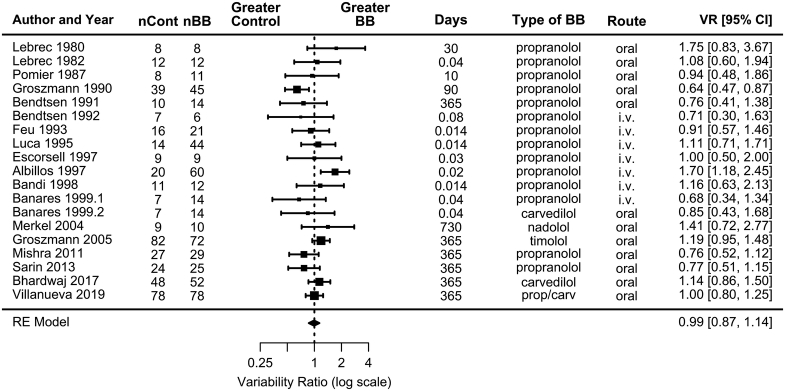
FIGURE 2.
Forest plot showing VR of the 19 study arms (in 18 studies) comparing the effects of beta-blockers versus placebo (or control) on portal pressure. Studies are summarized in Table 1. Values of VR below 1 indicate a greater variability in the final HVPG in the control than in the treatment group. Values over 1 indicate a greater variability in the final HVPG in the treatment group. A VR significantly greater than 1 would support that beta-blocker treatment has a heterogeneous patient-to-patient effect on HVPG (a patient-by-treatment interaction), whereas a VR not significantly different from 1 (as found in the present study) would support the notion that the average decrease in HVPG observed with beta-blockers can be assumed to apply to all patients. Abbreviation: BB, beta-blockers; nCont, number of patients assessed in the control group; nBB, number of patients assessed in the beta-blocker group; Days, duration of treatment in days; Route, route of administration; VR, variability ratio.

