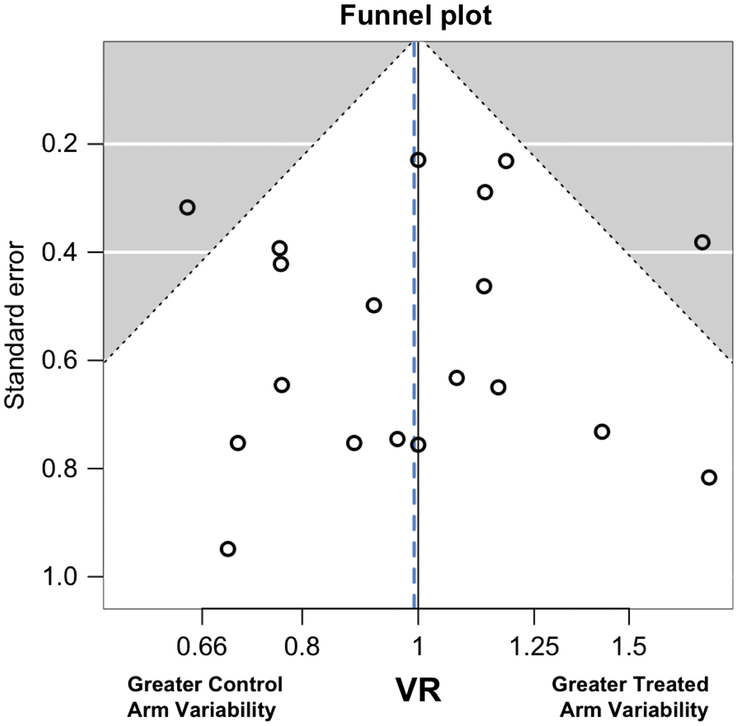
FIGURE 3.

Funnel plot showing the VR at outcome between treatment and control arms with the 19 comparisons. Vertical axis indicates the precision of the estimate of the VR (estimated by the SE), with points inside the triangle indicating the 95% most probable. The 2 points outside of the triangle correspond to the 2 studies identified in the text as being outliers.19,20 Points on the right indicate higher outcome variability for the treated individuals, as expected if there is heterogeneity in treatment effects. Points on the left correspond to lower variability in the treatment arm, which implies a more homogenous response after treatment. The vertical dashed line corresponds to the pooled VR. The distribution of the studies was symmetrical, suggesting that the study-to-study variation in the VRs occurred by chance. Abbreviation: VR, variability ratio.
